Win Probability
Last updated: 2025-10-25

NFL Win Probability
The NFL Win Probability Tool is available here.
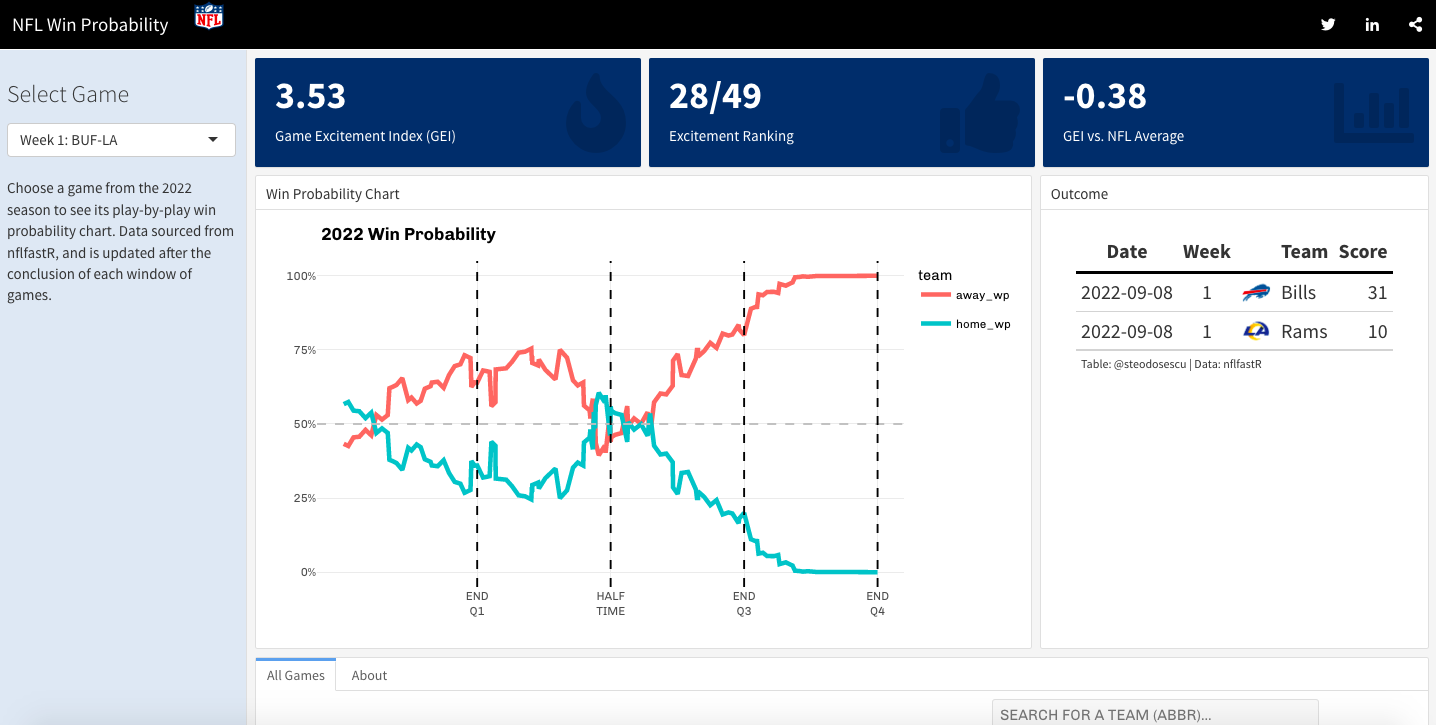
This dashboard looks at individual NFL game win probability. It uses play-by-play data from Ben Baldwin and Sebastian Carl’s nflfastR package. nflfastR is an extension of the original work done by the nflscrapR team (Maksim Horowitz, Ron Yurko, and Sam Ventura). App created by Stephan Teodosescu.
What is Win Probability?
Win Probability (WP) is an estimate of a team’s likelihood of winning the game at a point in time given the current situation at the start of that play. Win Probability Added (WPA) is the change in WP from one play to the next. If you graph these WP changes throughout the course of the game you will get a visual representation of how that game played out. The nflfastR model uses logistic regression to model likelihood of winning after each play of the game based on the score, field position, home field advantage, distance to the first down, time remaining, etc.
How do we measure game excitement?
To measure how exciting an individual game is, I computed a Game Excitement Index (GEI) similar to what Luke Benz has done in college basketball. The approach is to sum the absolute value of the win probability change from each play and multiply by a normalized time parameter. This gives us an index by which we can rank each game’s excitement factor. The way to interpret, for example, a Game Excitement Index of 4.0 is that the win probability changed by a total of 400% over the course of that game. The higher the number, the more exciting the game.
GEI is not a perfect metric, and it might fail to capture important aspects of the game that fans might find exciting, but it does give us a sense of the flow of games and a way to quantify the excitement of playoff football. I wrote about this idea at my blog Between the Pipes in January 2022.
More on these metrics and the models underpinning them can be found at Open Source Football.
Copyright © 2021 Stephan Teodosescu