Players Weekly Report
Last updated: 2026-01-07

Below you’ll find figures showing key advanced metrics I’m tracking for individual players throughout the season.
Quarterback Performance
Quarterback Summary
The below shows a summary of QB performances so far this season.
| Quarterback Passing Summary | ||||||||||
| Minimum 100 pass yards, and ordered by passing TDs thrown. Thru Week 18. | ||||||||||
| Player | Team | Comps | Att | Pass Yds | Pass TDs | INTs | Comp % | Pass EPA | ||
|---|---|---|---|---|---|---|---|---|---|---|
| AFC - East | ||||||||||
 |
Drake Maye |  |
NE | 354 | 492 | 4394 | 31 | 8 | 72.0% | 165.2 |
 |
Josh Allen |  |
BUF | 319 | 460 | 3668 | 25 | 10 | 69.3% | 71.3 |
 |
Tua Tagovailoa |  |
MIA | 248 | 361 | 2560 | 20 | 12 | 68.7% | 37.9 |
 |
Justin Fields |  |
NYJ | 104 | 153 | 1087 | 6 | 0 | 68.0% | 27.2 |
 |
Mitchell Trubisky | |
BUF | 22 | 29 | 259 | 4 | 0 | 75.9% | 22.5 |
 |
Quinn Ewers | |
MIA | 50 | 75 | 569 | 3 | 3 | 66.7% | 0.8 |
 |
Tyrod Taylor | |
NYJ | 72 | 119 | 717 | 4 | 4 | 60.5% | −12.4 |
 |
Brady Cook | |
NYJ | 77 | 131 | 679 | 1 | 7 | 58.8% | −62.0 |
| AFC - North | ||||||||||
 |
Joe Burrow |  |
CIN | 166 | 246 | 1733 | 16 | 5 | 67.5% | 36.4 |
 |
Aaron Rodgers |  |
PIT | 327 | 498 | 3322 | 24 | 7 | 65.7% | 26.8 |
 |
Lamar Jackson |  |
BAL | 192 | 302 | 2549 | 21 | 7 | 63.6% | 18.2 |
 |
Joe Flacco | |
CIN | 154 | 250 | 1636 | 13 | 4 | 61.6% | 17.8 |
 |
Tyler Huntley | |
BAL | 33 | 42 | 293 | 2 | 0 | 78.6% | 11.8 |
 |
Mason Rudolph | |
PIT | 36 | 47 | 298 | 2 | 1 | 76.6% | 4.9 |
 |
Cooper Rush | |
BAL | 14 | 20 | 179 | 0 | 3 | 70.0% | −7.9 |
 |
Jake Browning | |
CIN | 80 | 124 | 757 | 6 | 8 | 64.5% | −39.2 |
 |
Dillon Gabriel |  |
CLE | 99 | 170 | 850 | 6 | 2 | 58.2% | −42.5 |
 |
Shedeur Sanders | |
CLE | 116 | 196 | 1353 | 7 | 9 | 59.2% | −44.9 |
|
Joe Flacco | |
CLE | 93 | 160 | 815 | 2 | 6 | 58.1% | −57.2 |
| AFC - South | ||||||||||
 |
Daniel Jones |  |
IND | 256 | 377 | 3041 | 19 | 7 | 67.9% | 66.5 |
 |
C.J. Stroud |  |
HOU | 267 | 413 | 2962 | 19 | 8 | 64.6% | 44.6 |
 |
Trevor Lawrence |  |
JAX | 341 | 560 | 4007 | 29 | 12 | 60.9% | 38.4 |
 |
Riley Leonard | |
IND | 39 | 63 | 415 | 2 | 2 | 61.9% | −2.4 |
 |
Philip Rivers | |
IND | 58 | 92 | 544 | 4 | 3 | 63.0% | −11.2 |
 |
Davis Mills | |
HOU | 86 | 146 | 856 | 5 | 1 | 58.9% | −11.4 |
 |
Cam Ward |  |
TEN | 320 | 537 | 3117 | 15 | 7 | 59.6% | −113.5 |
| AFC - West | ||||||||||
 |
Patrick Mahomes |  |
KC | 315 | 502 | 3587 | 22 | 11 | 62.7% | 68.2 |
 |
Bo Nix |  |
DEN | 388 | 612 | 3931 | 25 | 11 | 63.4% | 63.3 |
 |
Justin Herbert |  |
LAC | 330 | 494 | 3646 | 26 | 12 | 66.8% | 30.4 |
 |
Chris Oladokun | |
KC | 11 | 16 | 111 | 0 | 0 | 68.8% | −5.8 |
 |
Aidan O'Connell |  |
LV | 10 | 22 | 102 | 0 | 0 | 45.5% | −5.9 |
 |
Trey Lance | |
LAC | 20 | 44 | 136 | 0 | 1 | 45.5% | −31.5 |
 |
Geno Smith | |
LV | 292 | 432 | 2958 | 19 | 17 | 67.6% | −63.2 |
| NFC - East | ||||||||||
 |
Dak Prescott |  |
DAL | 397 | 589 | 4482 | 30 | 10 | 67.4% | 114.3 |
 |
Jalen Hurts |  |
PHI | 294 | 454 | 3224 | 25 | 6 | 64.8% | 34.3 |
 |
Jaxson Dart |  |
NYG | 209 | 326 | 2239 | 15 | 4 | 64.1% | 20.5 |
 |
Marcus Mariota |  |
WAS | 126 | 199 | 1507 | 10 | 5 | 63.3% | 19.5 |
 |
Jameis Winston | |
NYG | 37 | 65 | 567 | 2 | 2 | 56.9% | 16.9 |
 |
Josh Johnson | |
WAS | 29 | 45 | 329 | 1 | 1 | 64.4% | 8.3 |
 |
Jayden Daniels | |
WAS | 105 | 168 | 1184 | 8 | 2 | 62.5% | 5.4 |
 |
Tanner McKee | |
PHI | 21 | 40 | 241 | 1 | 1 | 52.5% | −6.2 |
 |
Russell Wilson | |
NYG | 65 | 110 | 778 | 3 | 3 | 59.1% | −9.1 |
| NFC - North | ||||||||||
 |
Jordan Love |  |
GB | 283 | 426 | 3304 | 23 | 6 | 66.4% | 110.5 |
 |
Jared Goff |  |
DET | 393 | 578 | 4564 | 34 | 8 | 68.0% | 106.5 |
 |
Caleb Williams |  |
CHI | 330 | 568 | 3942 | 27 | 7 | 58.1% | 42.2 |
 |
Malik Willis | |
GB | 27 | 32 | 409 | 2 | 0 | 84.4% | 25.6 |
 |
Carson Wentz |  |
MIN | 110 | 169 | 1216 | 6 | 5 | 65.1% | 6.3 |
 |
Max Brosmer | |
MIN | 19 | 30 | 126 | 0 | 4 | 63.3% | −29.1 |
 |
J.J. McCarthy | |
MIN | 128 | 224 | 1545 | 11 | 10 | 57.1% | −37.6 |
| NFC - South | ||||||||||
 |
Baker Mayfield |  |
TB | 334 | 524 | 3652 | 25 | 9 | 63.7% | 18.9 |
 |
Kirk Cousins |  |
ATL | 155 | 248 | 1644 | 10 | 5 | 62.5% | 5.9 |
 |
Michael Penix Jr. | |
ATL | 166 | 276 | 1982 | 9 | 3 | 60.1% | 5.1 |
 |
Tyler Shough |  |
NO | 221 | 325 | 2384 | 10 | 6 | 68.0% | 3.8 |
 |
Bryce Young |  |
CAR | 290 | 454 | 2957 | 23 | 10 | 63.9% | −0.9 |
 |
Andy Dalton | |
CAR | 16 | 24 | 175 | 0 | 1 | 66.7% | −12.9 |
 |
Spencer Rattler | |
NO | 174 | 256 | 1586 | 8 | 5 | 68.0% | −21.6 |
| NFC - West | ||||||||||
 |
Matthew Stafford |  |
LA | 388 | 597 | 4707 | 46 | 8 | 65.0% | 150.5 |
 |
Sam Darnold |  |
SEA | 323 | 477 | 4048 | 25 | 14 | 67.7% | 74.6 |
 |
Brock Purdy |  |
SF | 197 | 284 | 2167 | 20 | 10 | 69.4% | 63.1 |
 |
Mac Jones | |
SF | 201 | 289 | 2151 | 13 | 6 | 69.6% | 44.7 |
 |
Kyler Murray |  |
ARI | 110 | 161 | 962 | 6 | 3 | 68.3% | 5.7 |
 |
Jacoby Brissett | |
ARI | 315 | 484 | 3366 | 23 | 8 | 65.1% | −2.4 |
| Table: @steodosescu | Data: nflfastR | ||||||||||
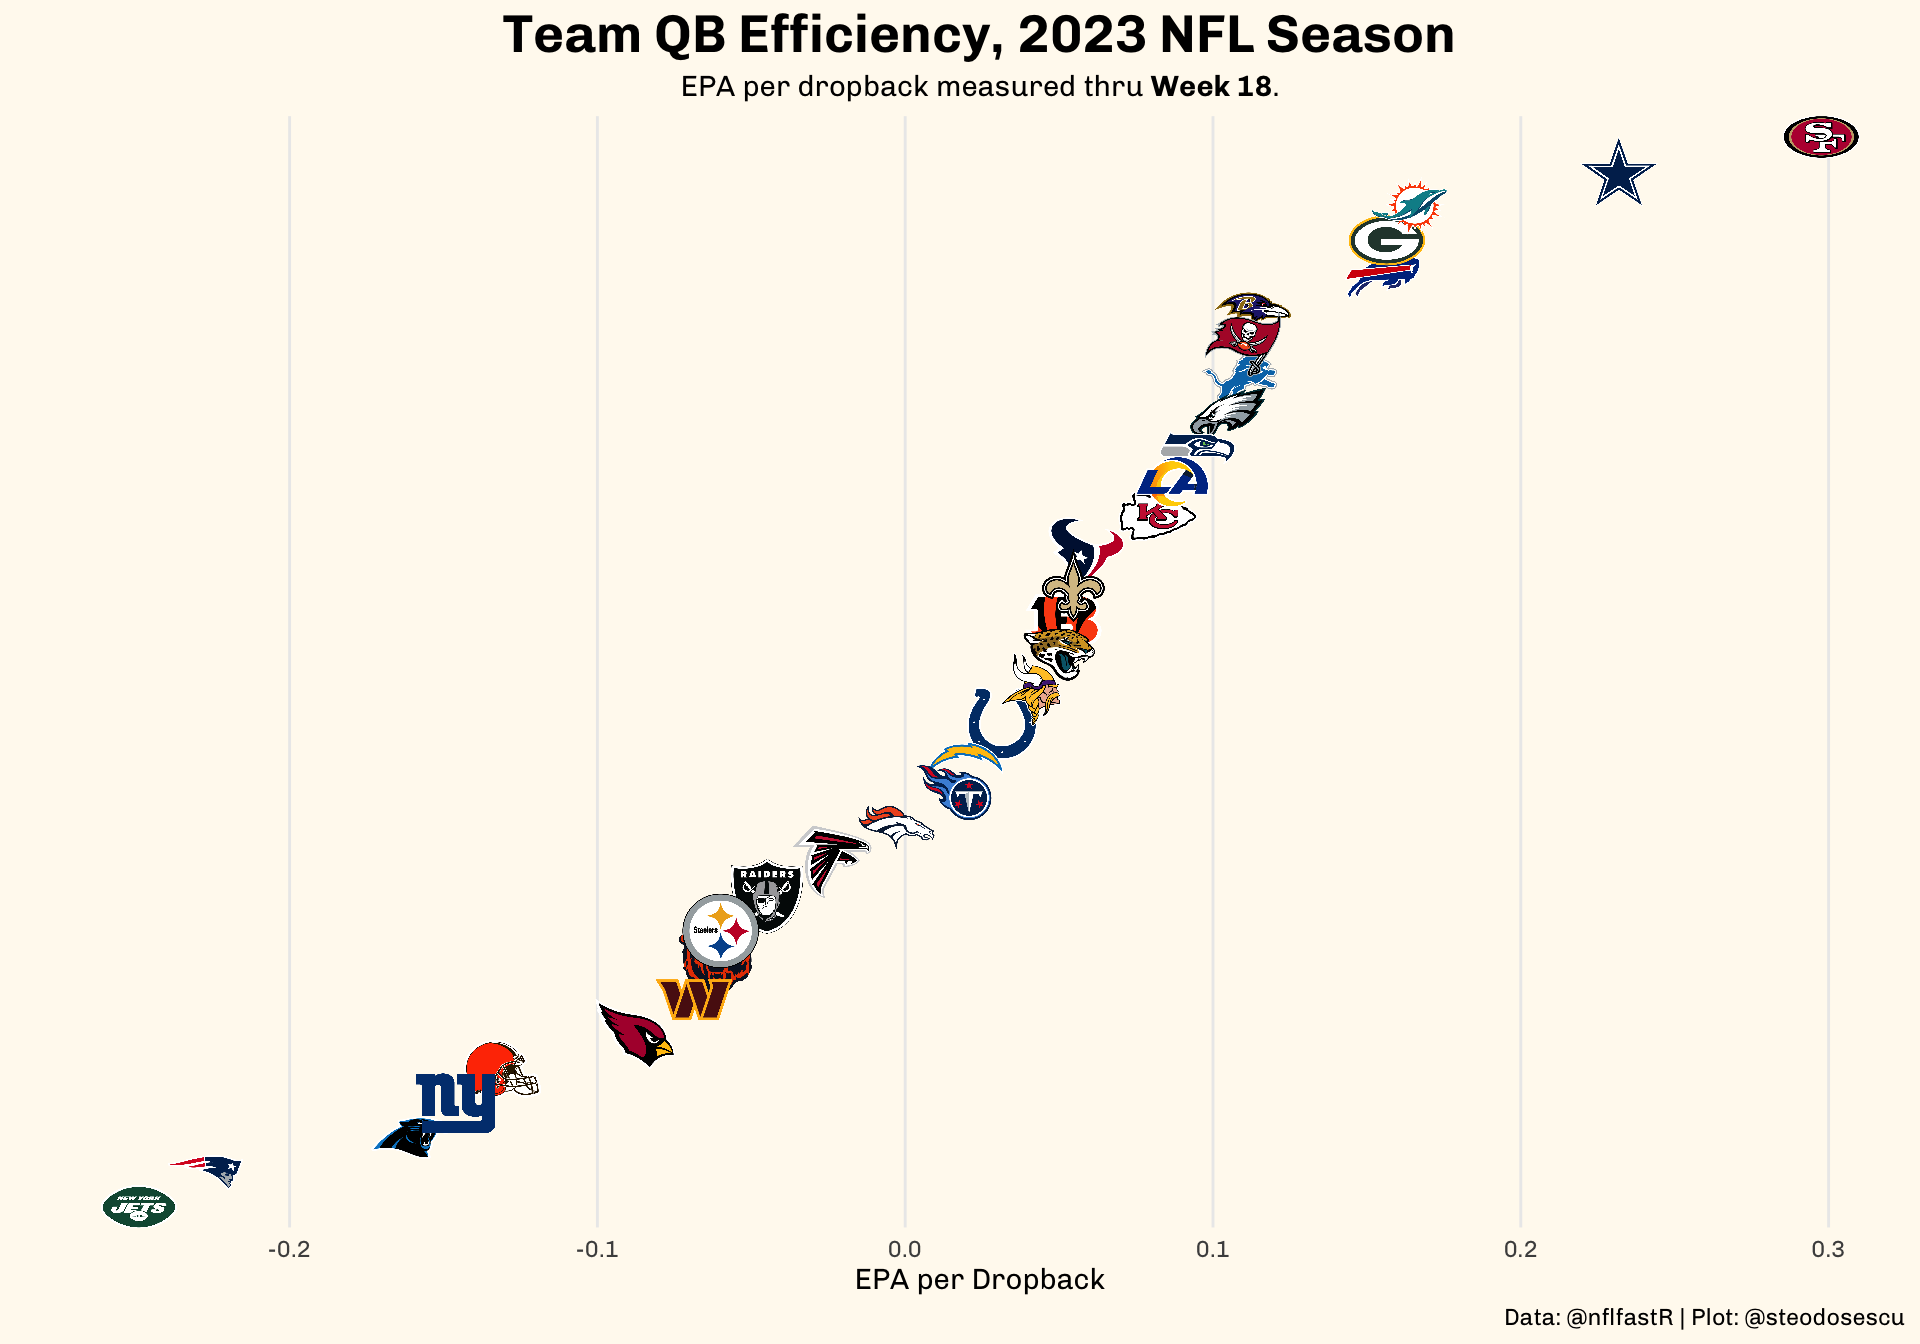
EPA per Dropback by Team
The below isolates Expected Points Added for pass plays only to get a sense of how each team’s quarterback is performing on a per-dropback basis.
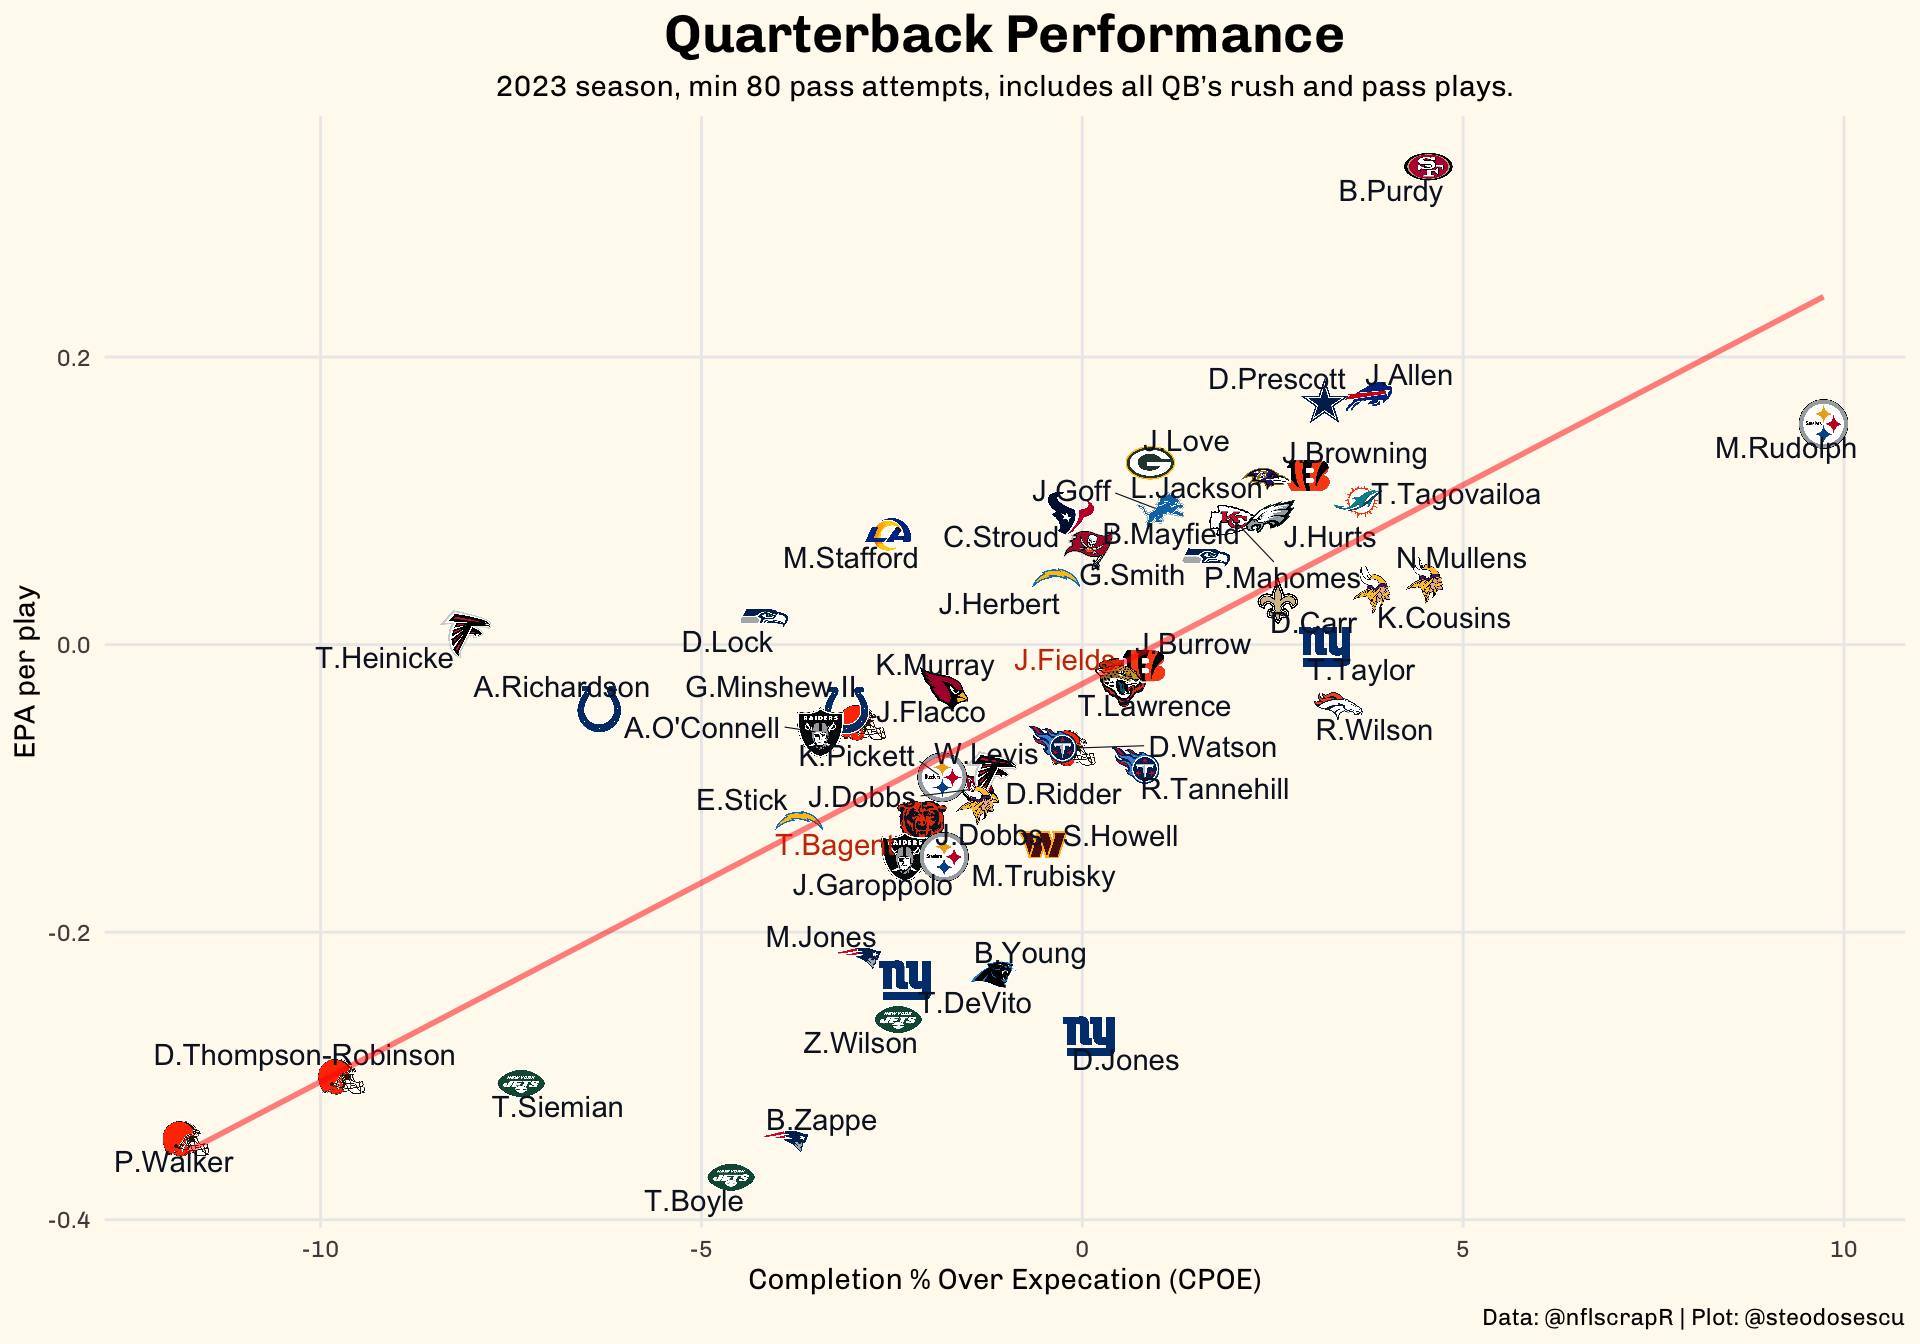
EPA vs CPOE per dropback by team
The below is another way to look at quarterback efficiency using EPA and Completion Percentage Over Expectation (CPOE) as measures. CPOE is simply the difference between a quarterback’s expected completion percentage and actual completion percentage. Expected completion percentage is a stat measuring the likelihood of a given pass being completed which factors in features like depth of target (air yards). It’s a better measure of accuracy than traditional completion percentage because it takes into account the location of where passes are being thrown.
Here we focus on quarterback play only as the QB position is the most valuable position on the field. As the quarterback goes, the team goes.
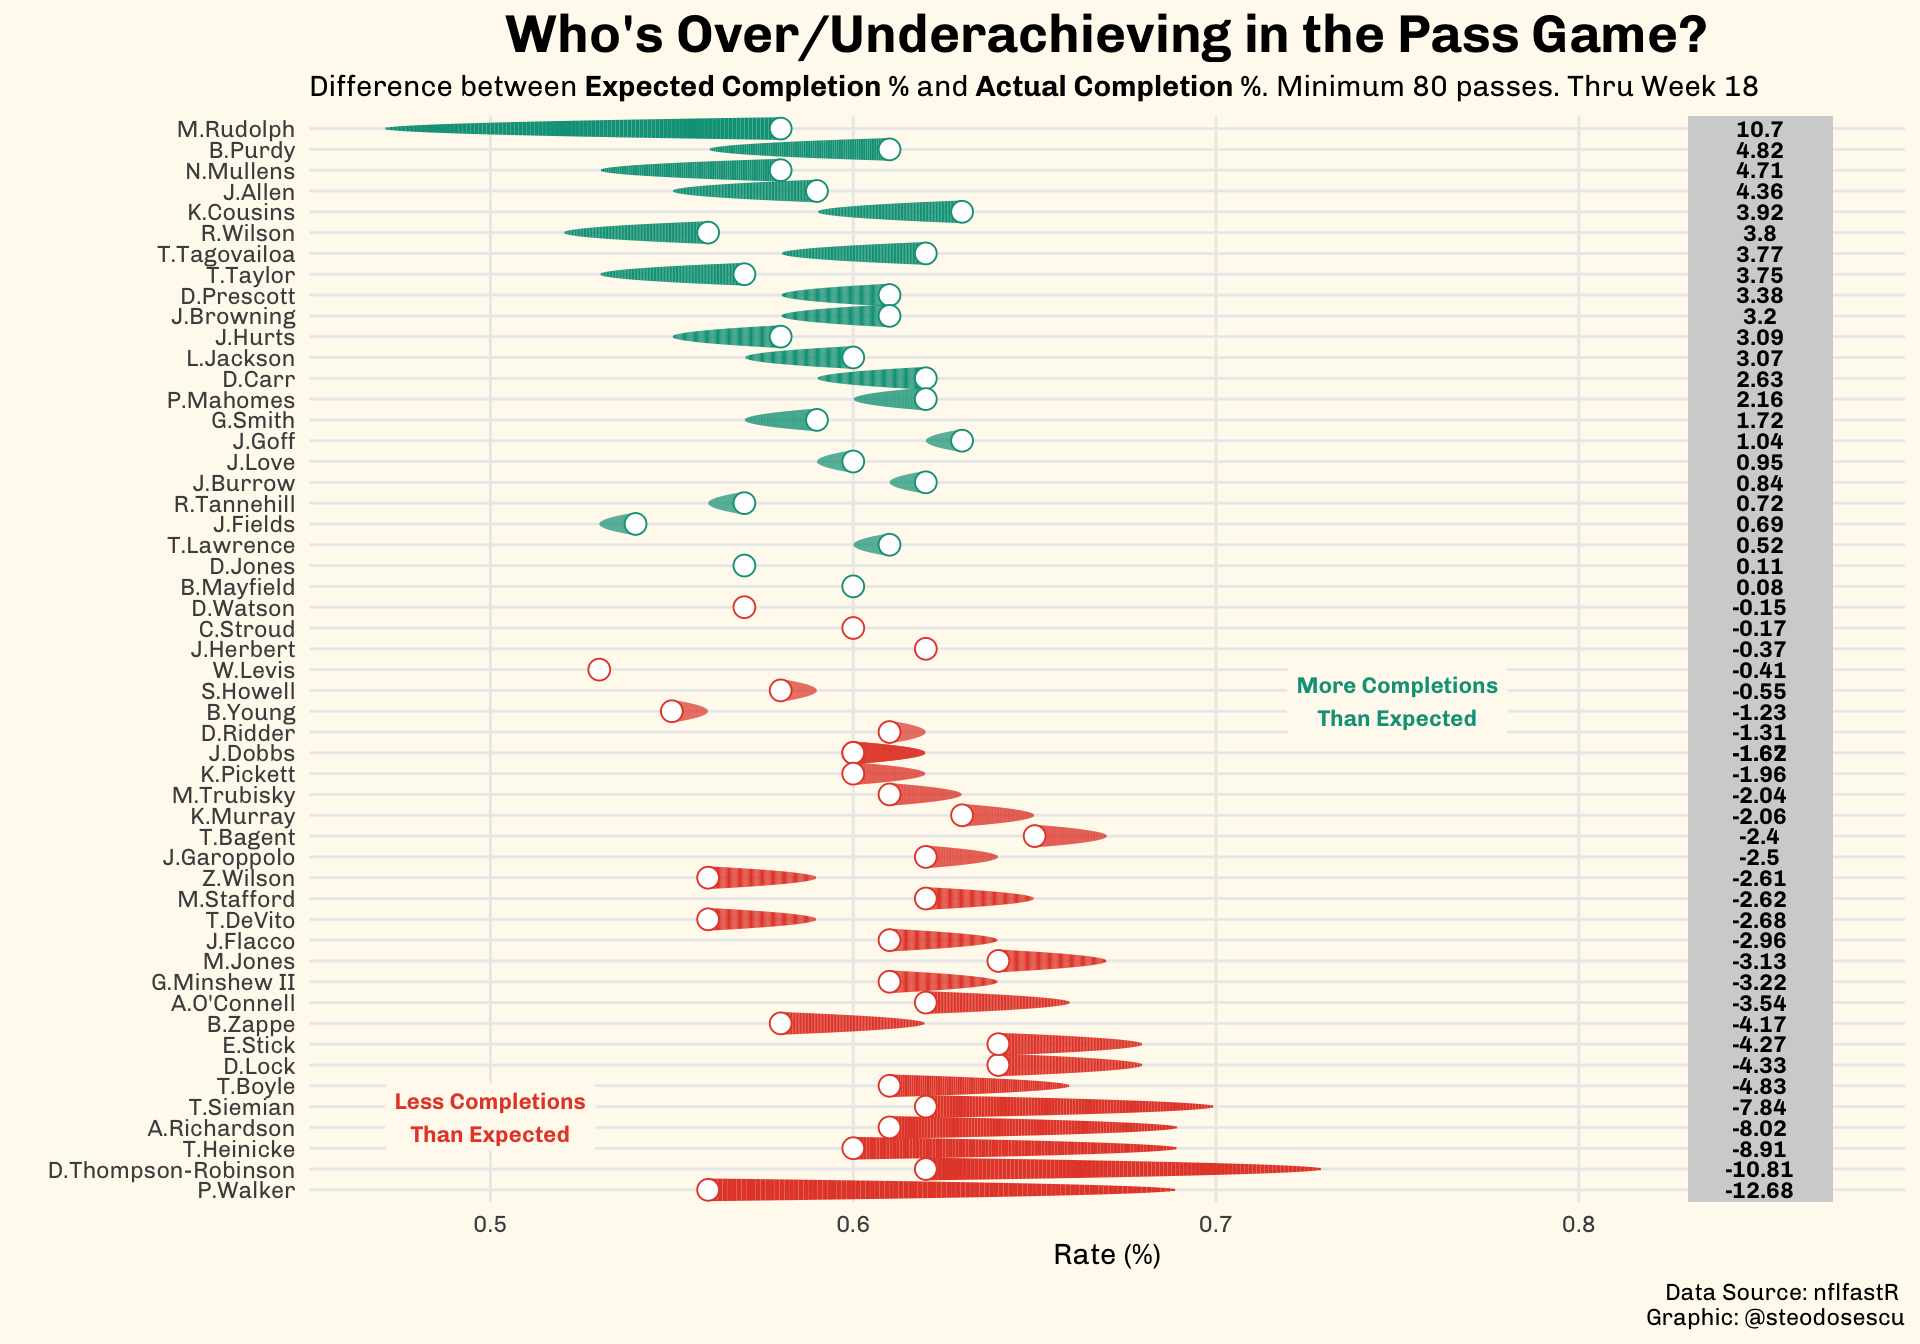
Difference in Expected and Actual Yards
The below shows what quarterbacks have completed a either higher percentage or lower percentage of their passes than expected, according to the nflfastR model.
Receivers Performance
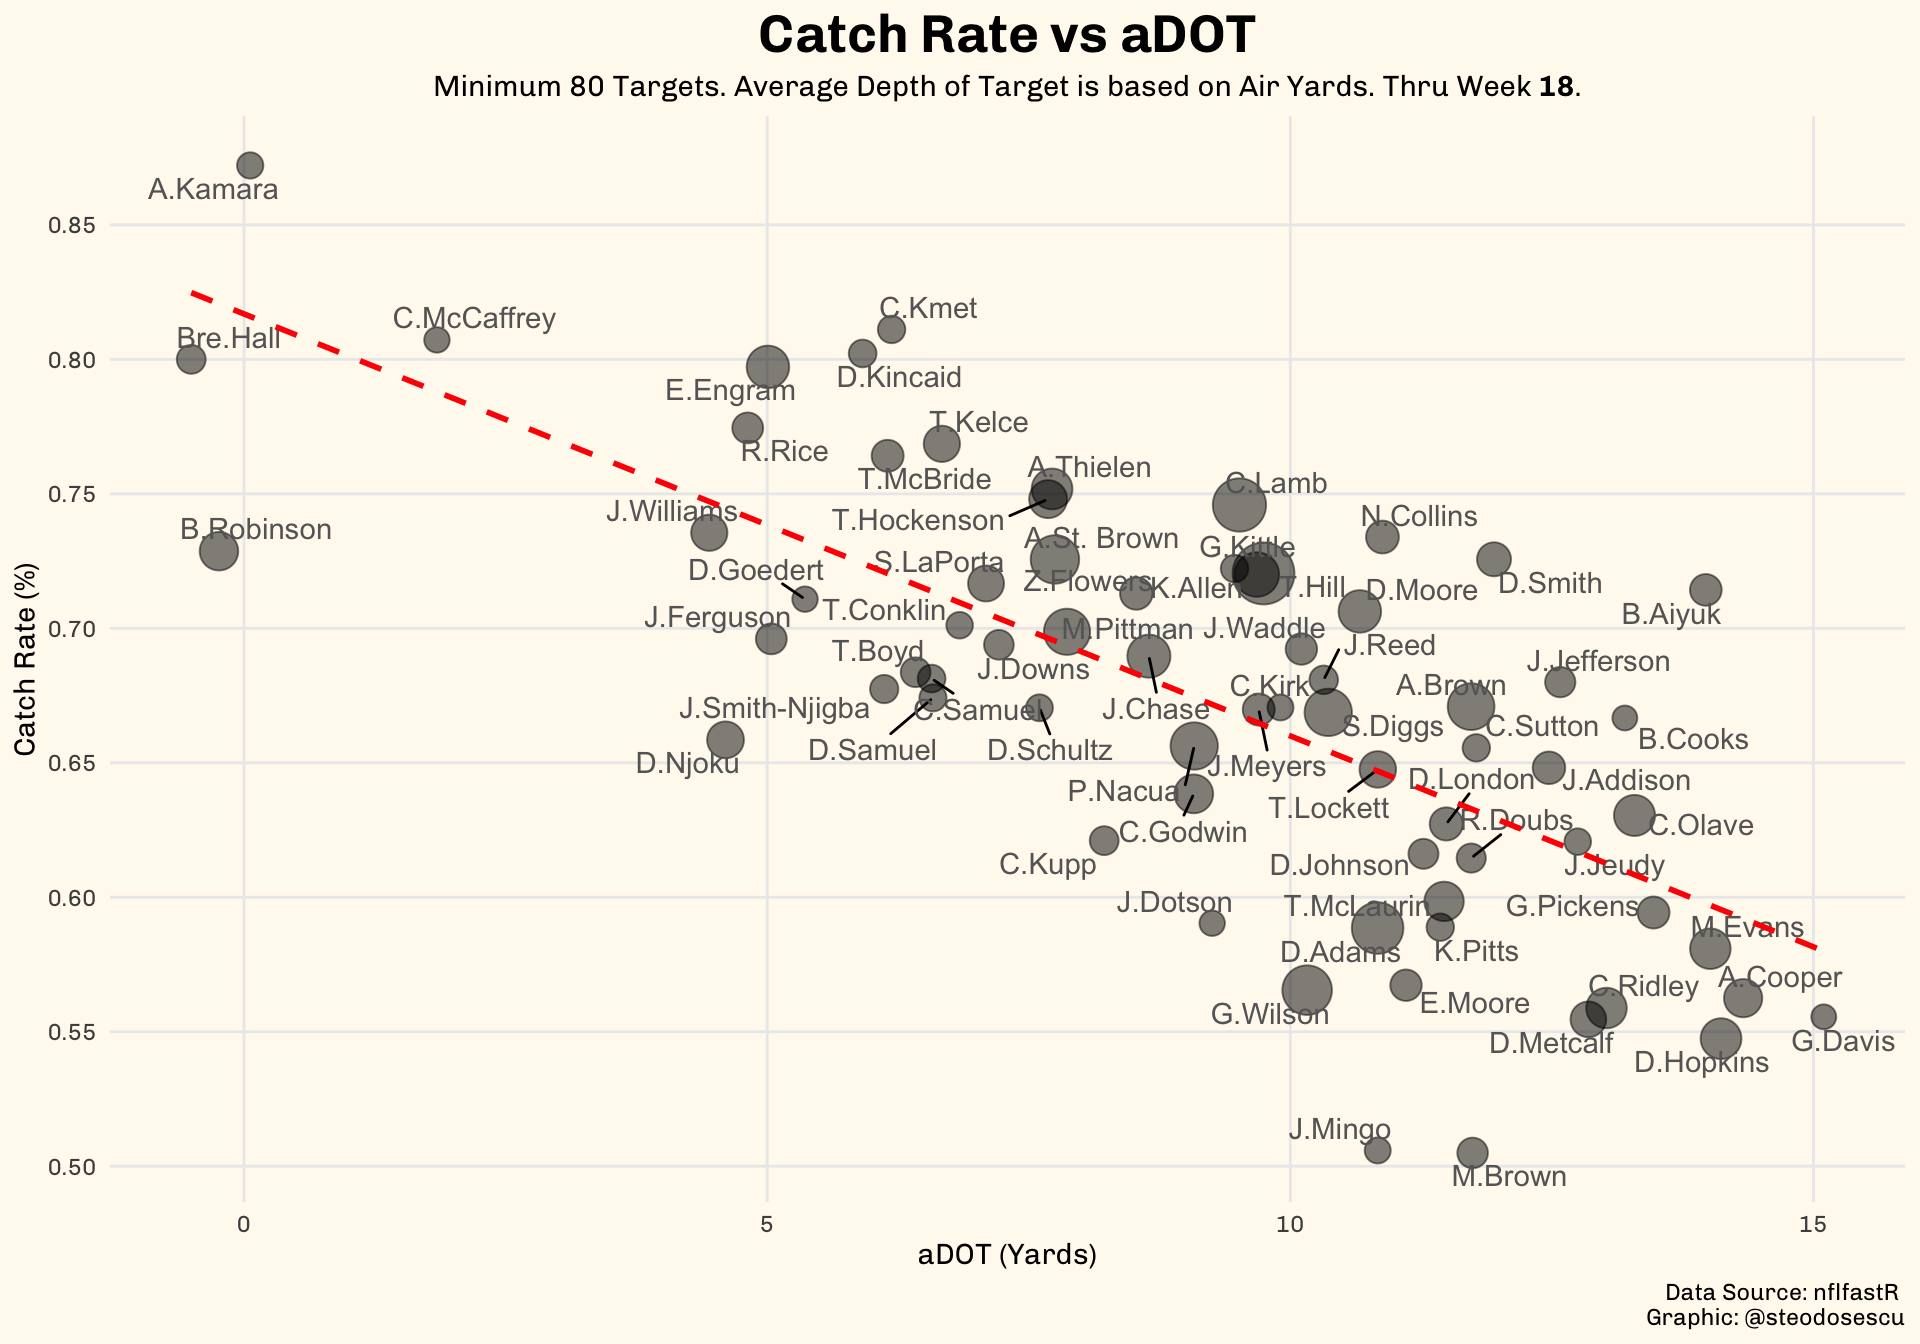
Receivers average Depth of Target (aDOT) vs. Catch Rate
The below shows receiver catch rate against their average depth of target (air yards).
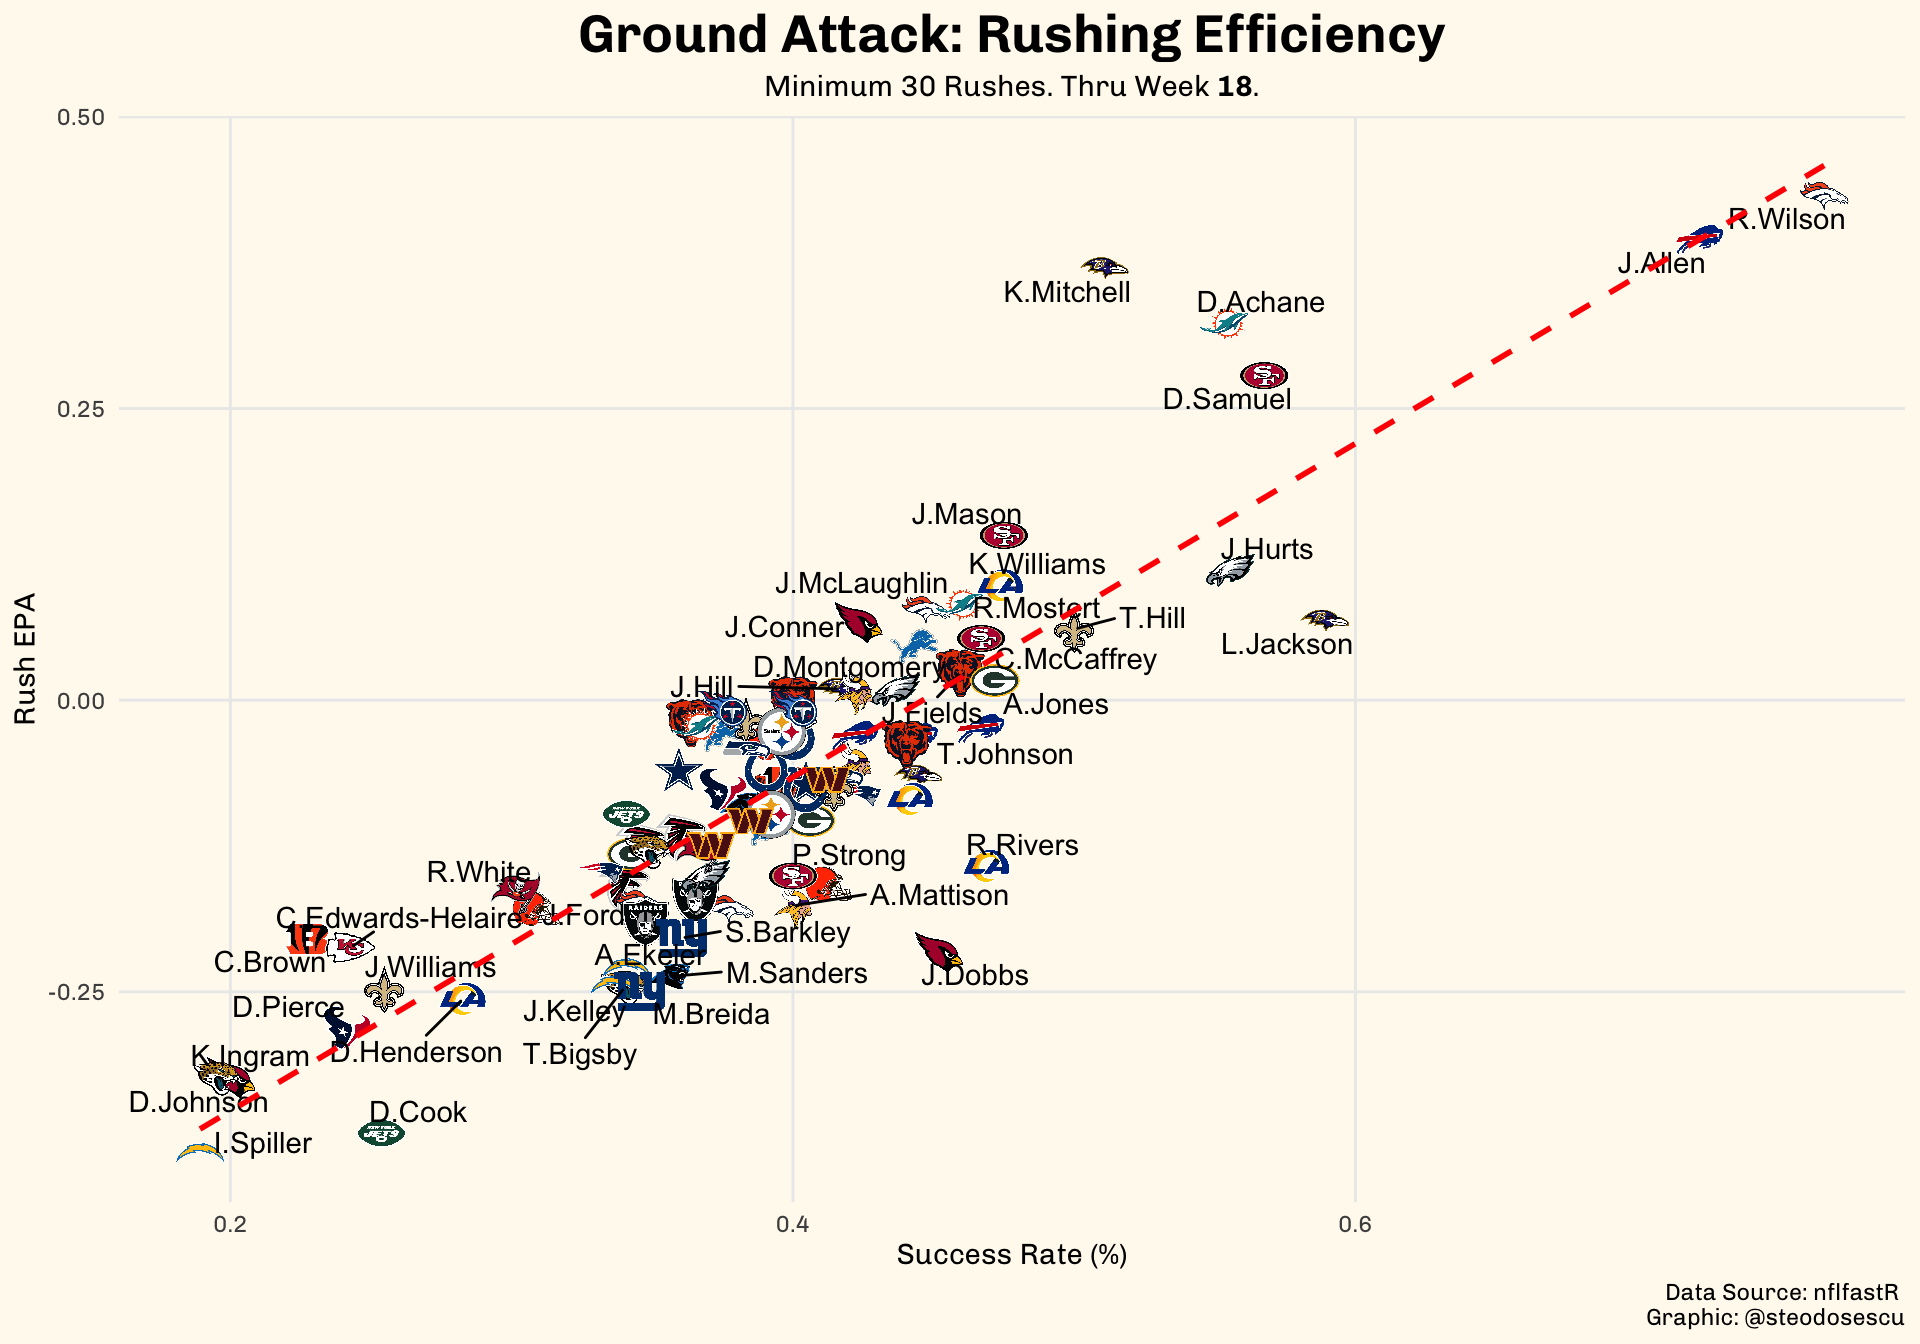
Rushing Performance
The below shows a rusher’s success rate vs his total EPA gained on runs this season.
Copyright © 2021 Stephan Teodosescu