Teams Weekly Report
Last updated: 2026-01-06

Below you’ll find figures showing key advanced metrics I’m tracking for all 32 NFL teams.
Team Level Performance
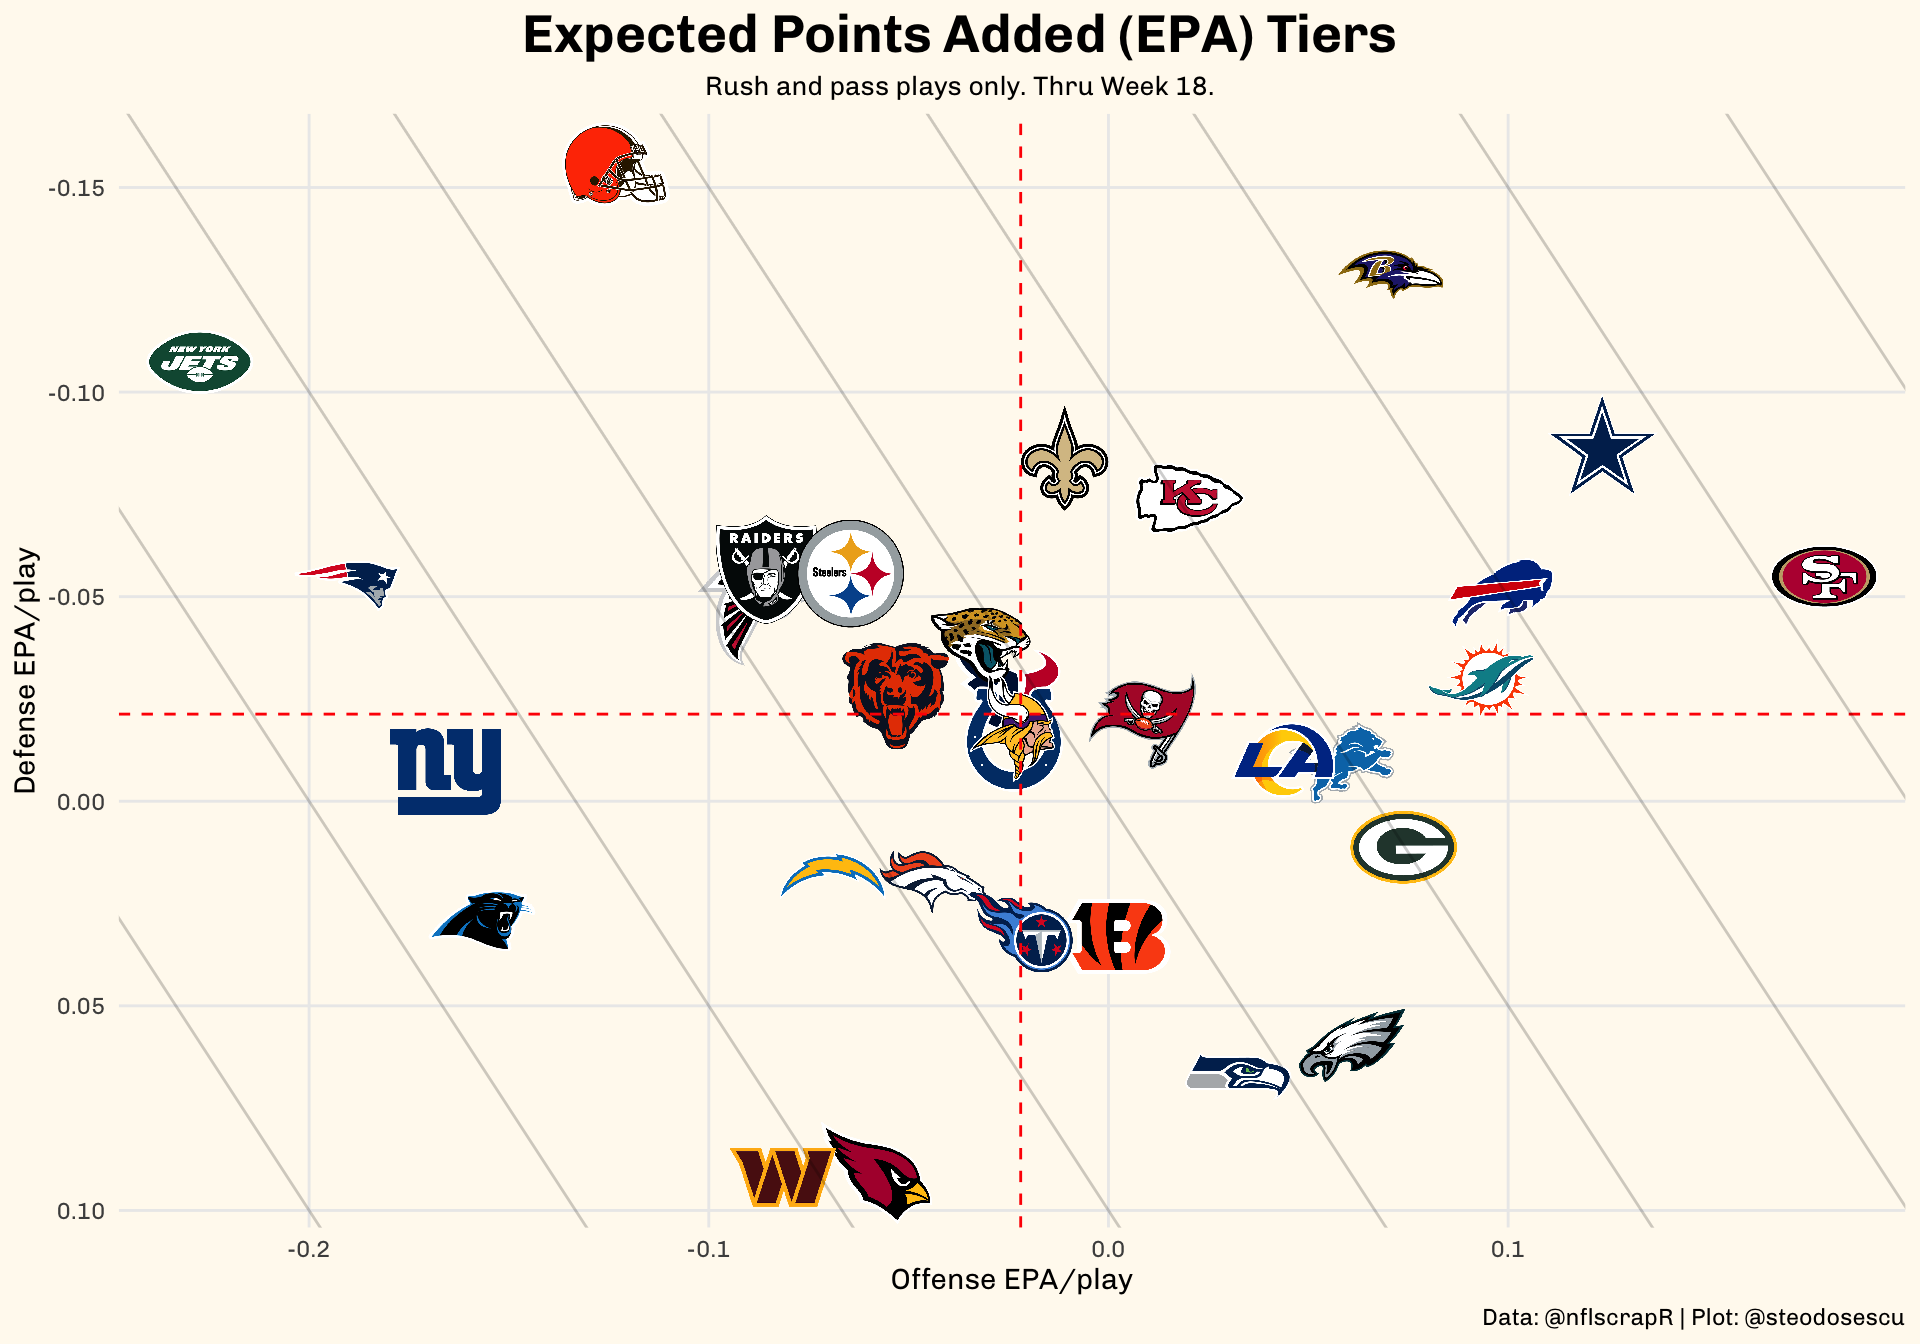
Offensive vs. Defensive EPA
Expected Points Added: The change in Expected Points (EP) from one play to the next. EPA yields a single measure of the value of every play. Expected Points was created by the nflfastR team using a statistical model trained on historical data, and takes into account features like down, distance, time remaining, whether the game is being played indoors, etc. It helps answer the question “How good of a position is my team in to score as of now?” Higher EPA on offense is better, while a lower EPA on defense is more desirable.
EPA helps provide better context around what plays are more valuable. For example, a five-yard completion on third-and-4 is better than an eight-yard completion on third-and-9, despite the fact that the latter resulted in more yards.
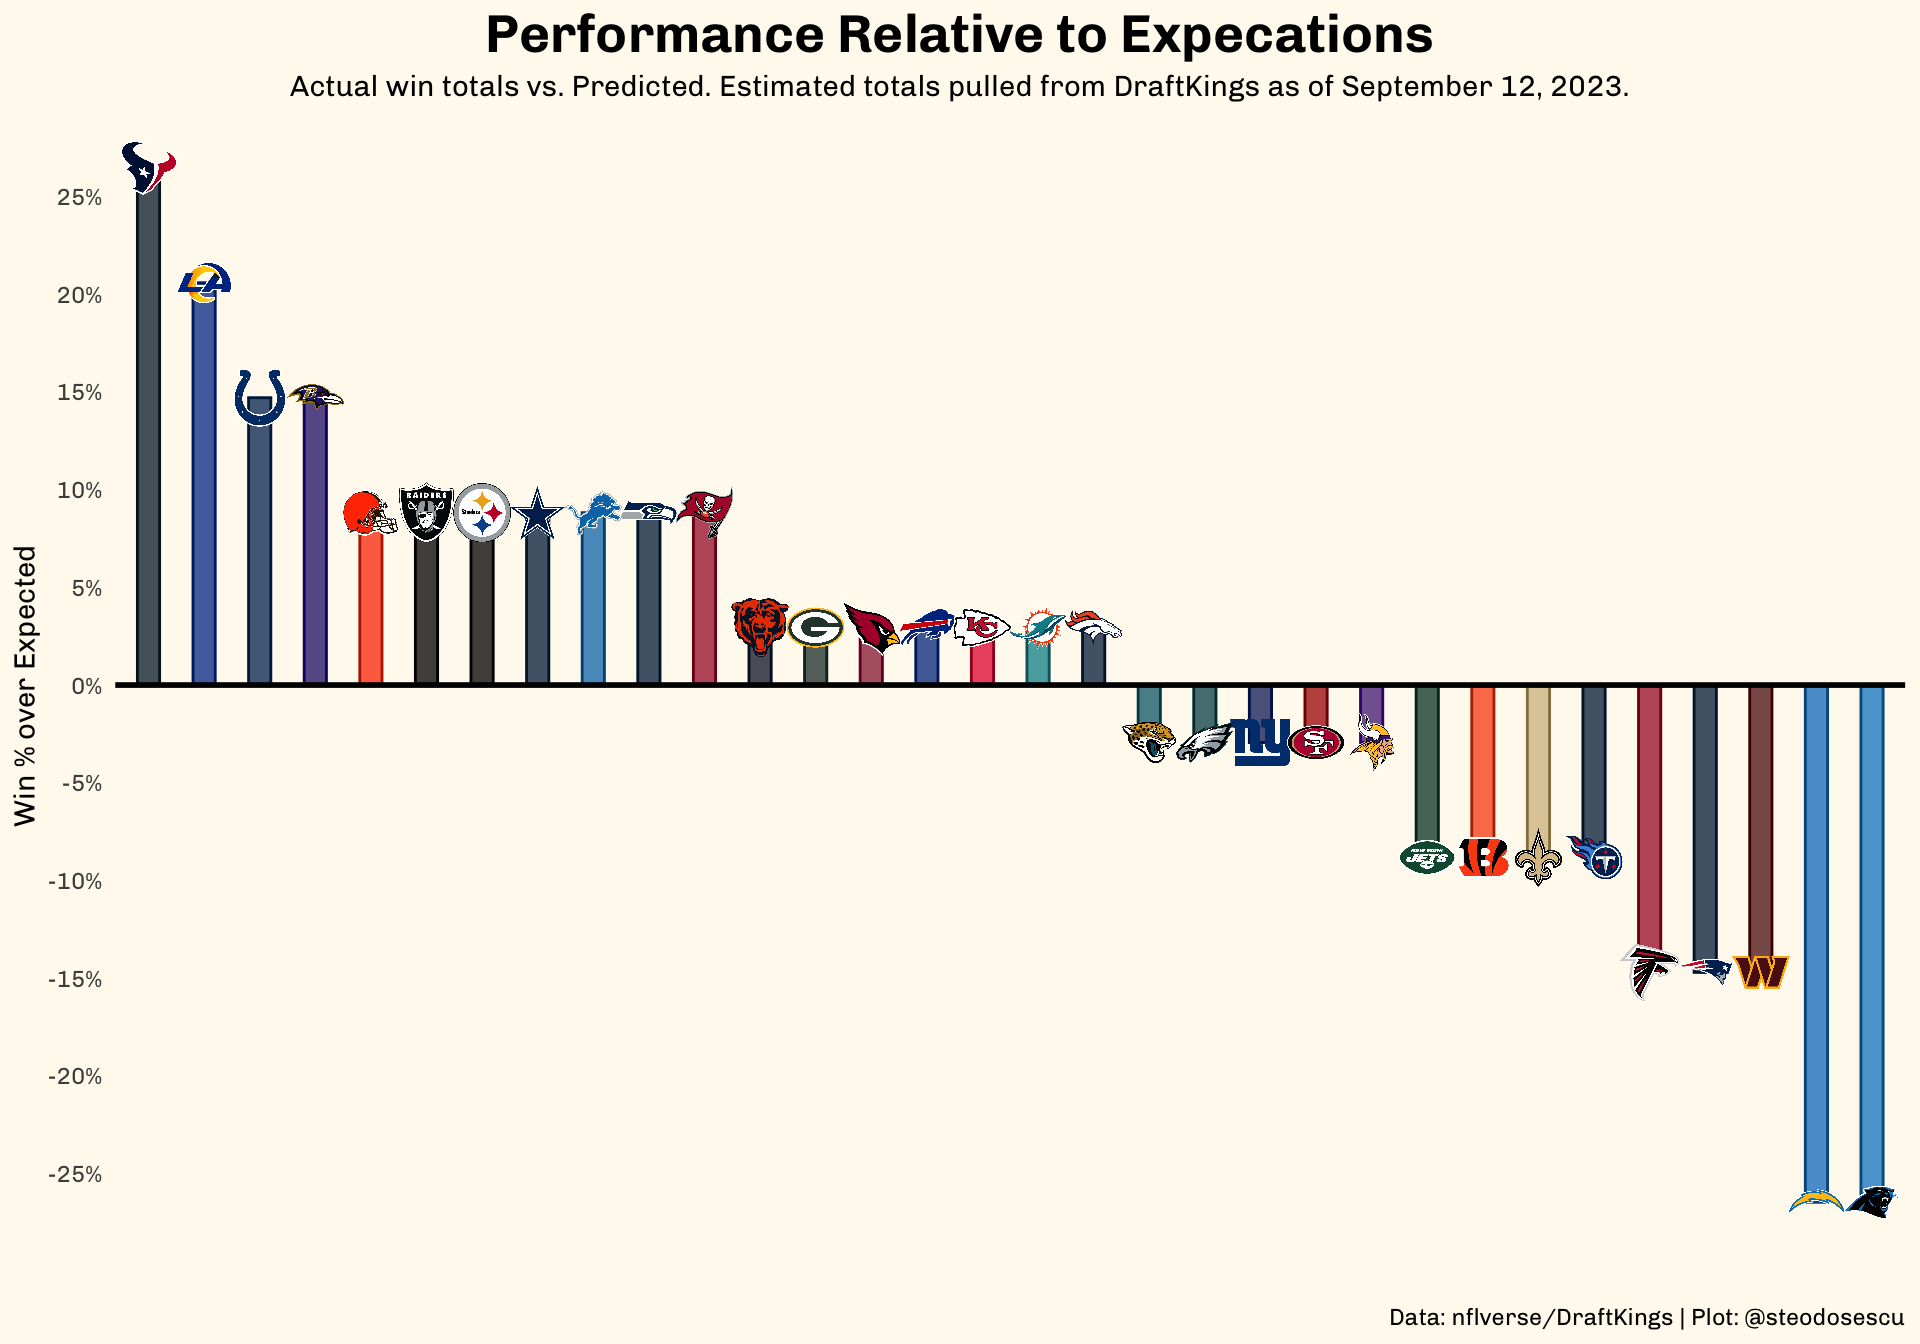
Performance vs Expectations
The below shows current win totals – expressed in win percentage – compared to pre-season win total expectations according to Vegas bookmakers. Bet365 data was pulled one week before the season began for this analysis.
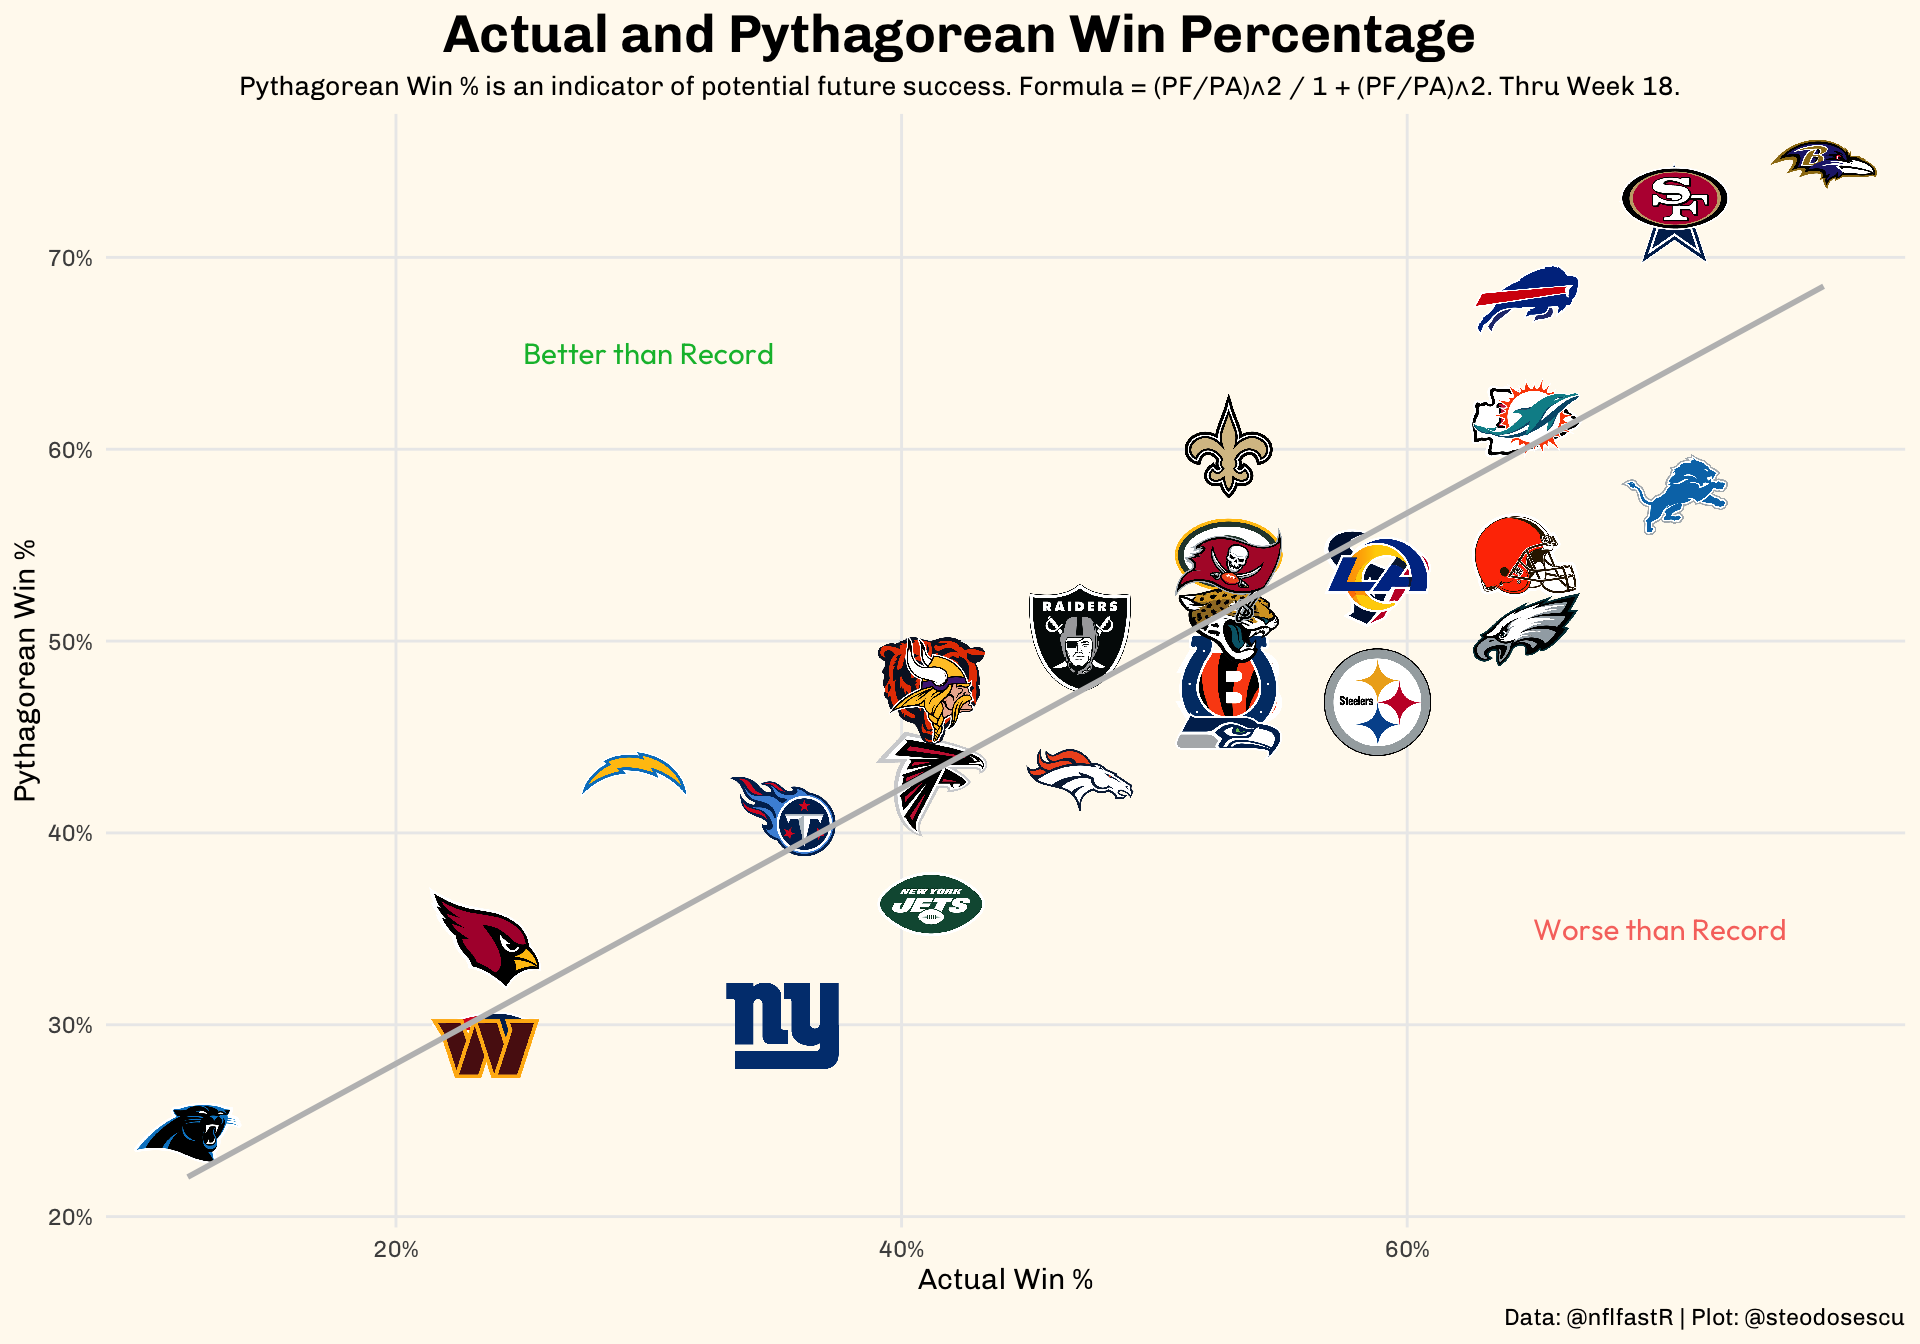
Pythagorean Wins
The below shows each team’s actual win percentage vs their pythagoroean win percentage. Pythagorean winning percentage is important to look at because it’s a better predictor of future success than actual wins. According to Sumer Sports, pythagorean winning percentage has an R^2 of 0.14 to next year’s winning percentage while actual winning percentage is only 0.11.
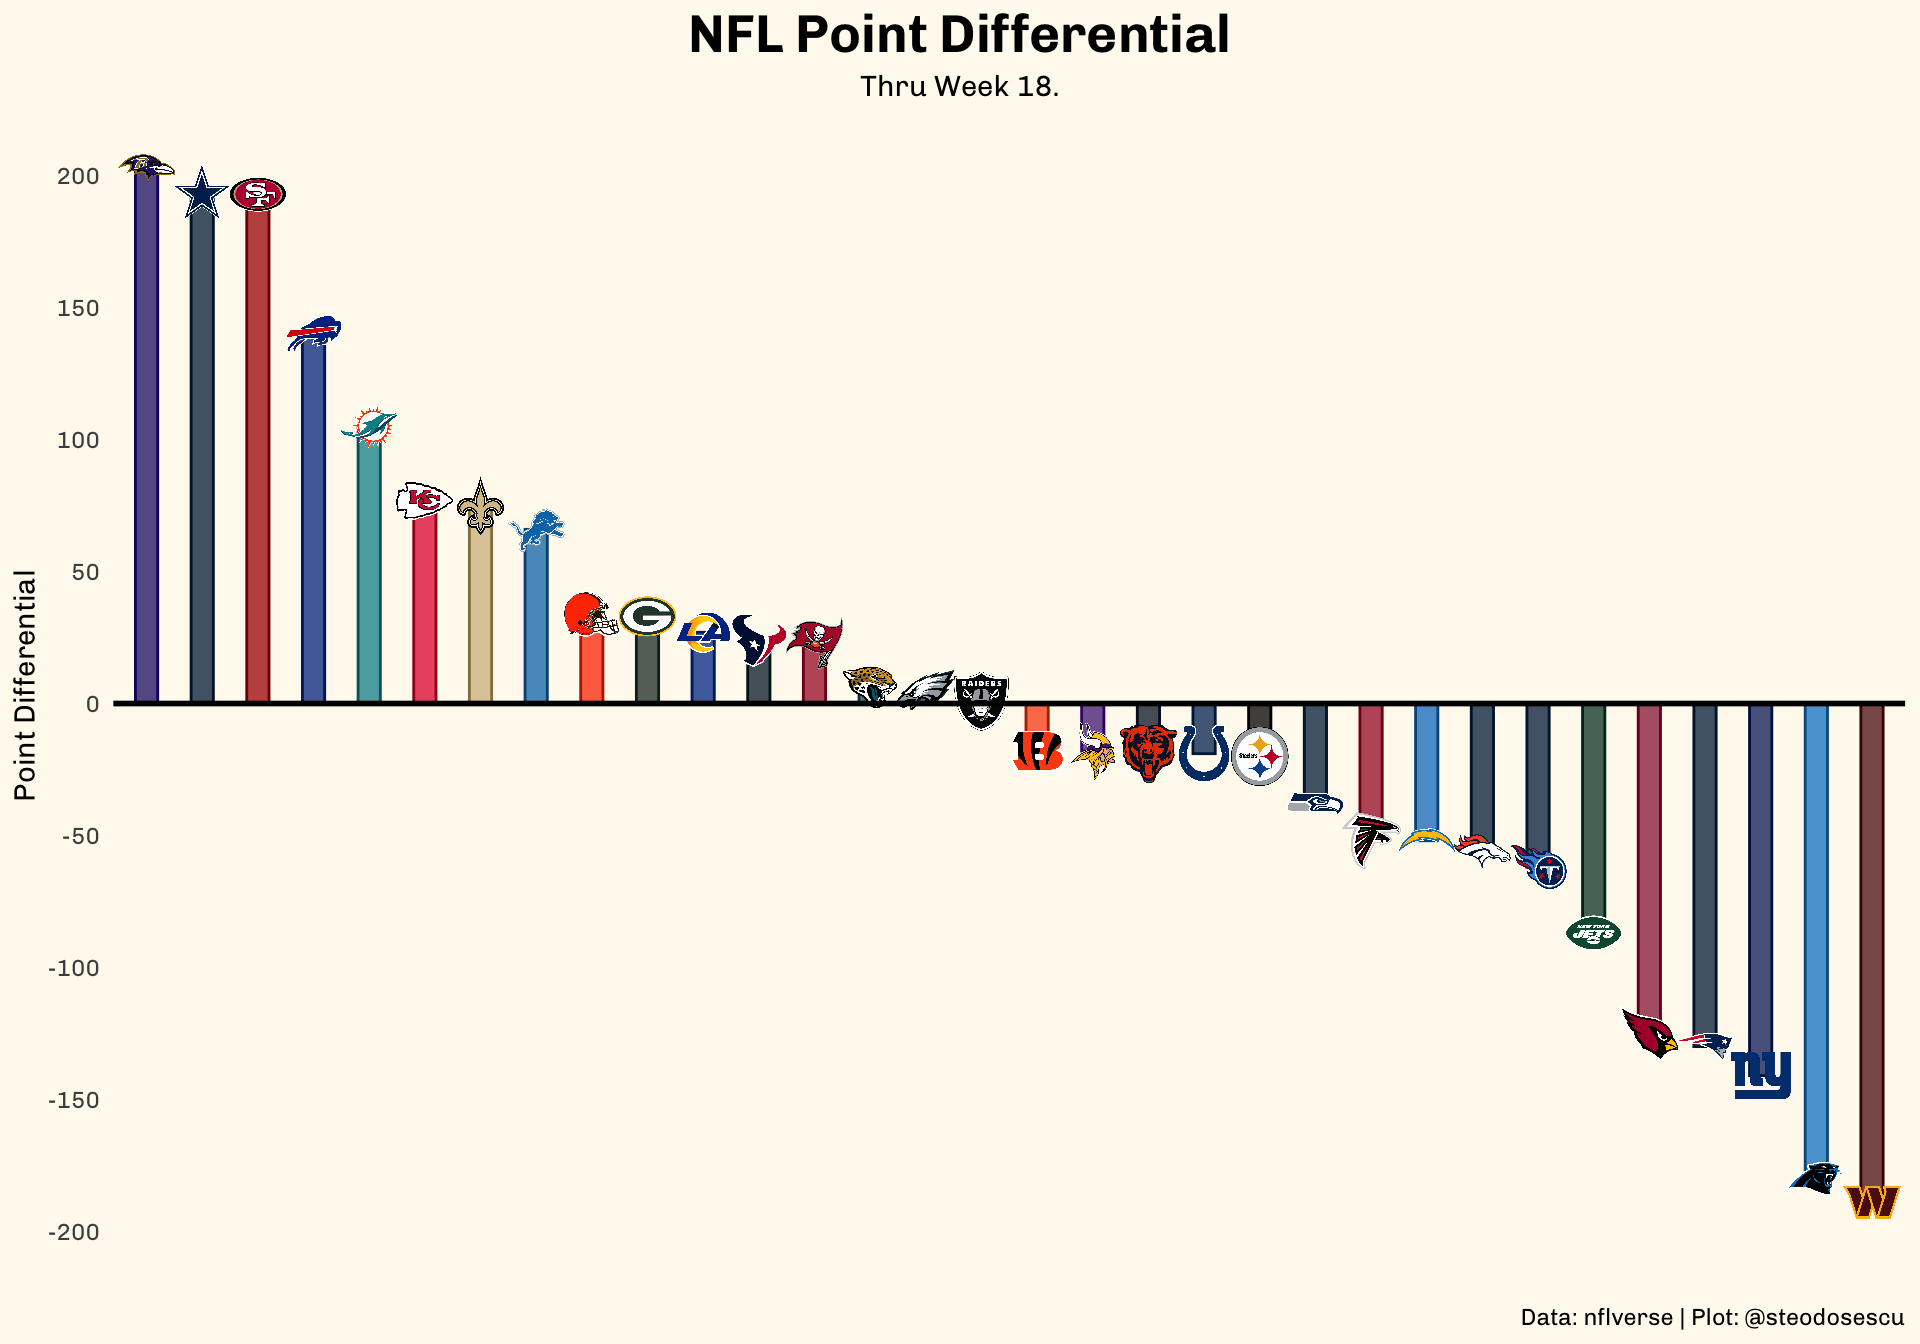
Point Differential
The below shows cumulative point differential for each team this season.
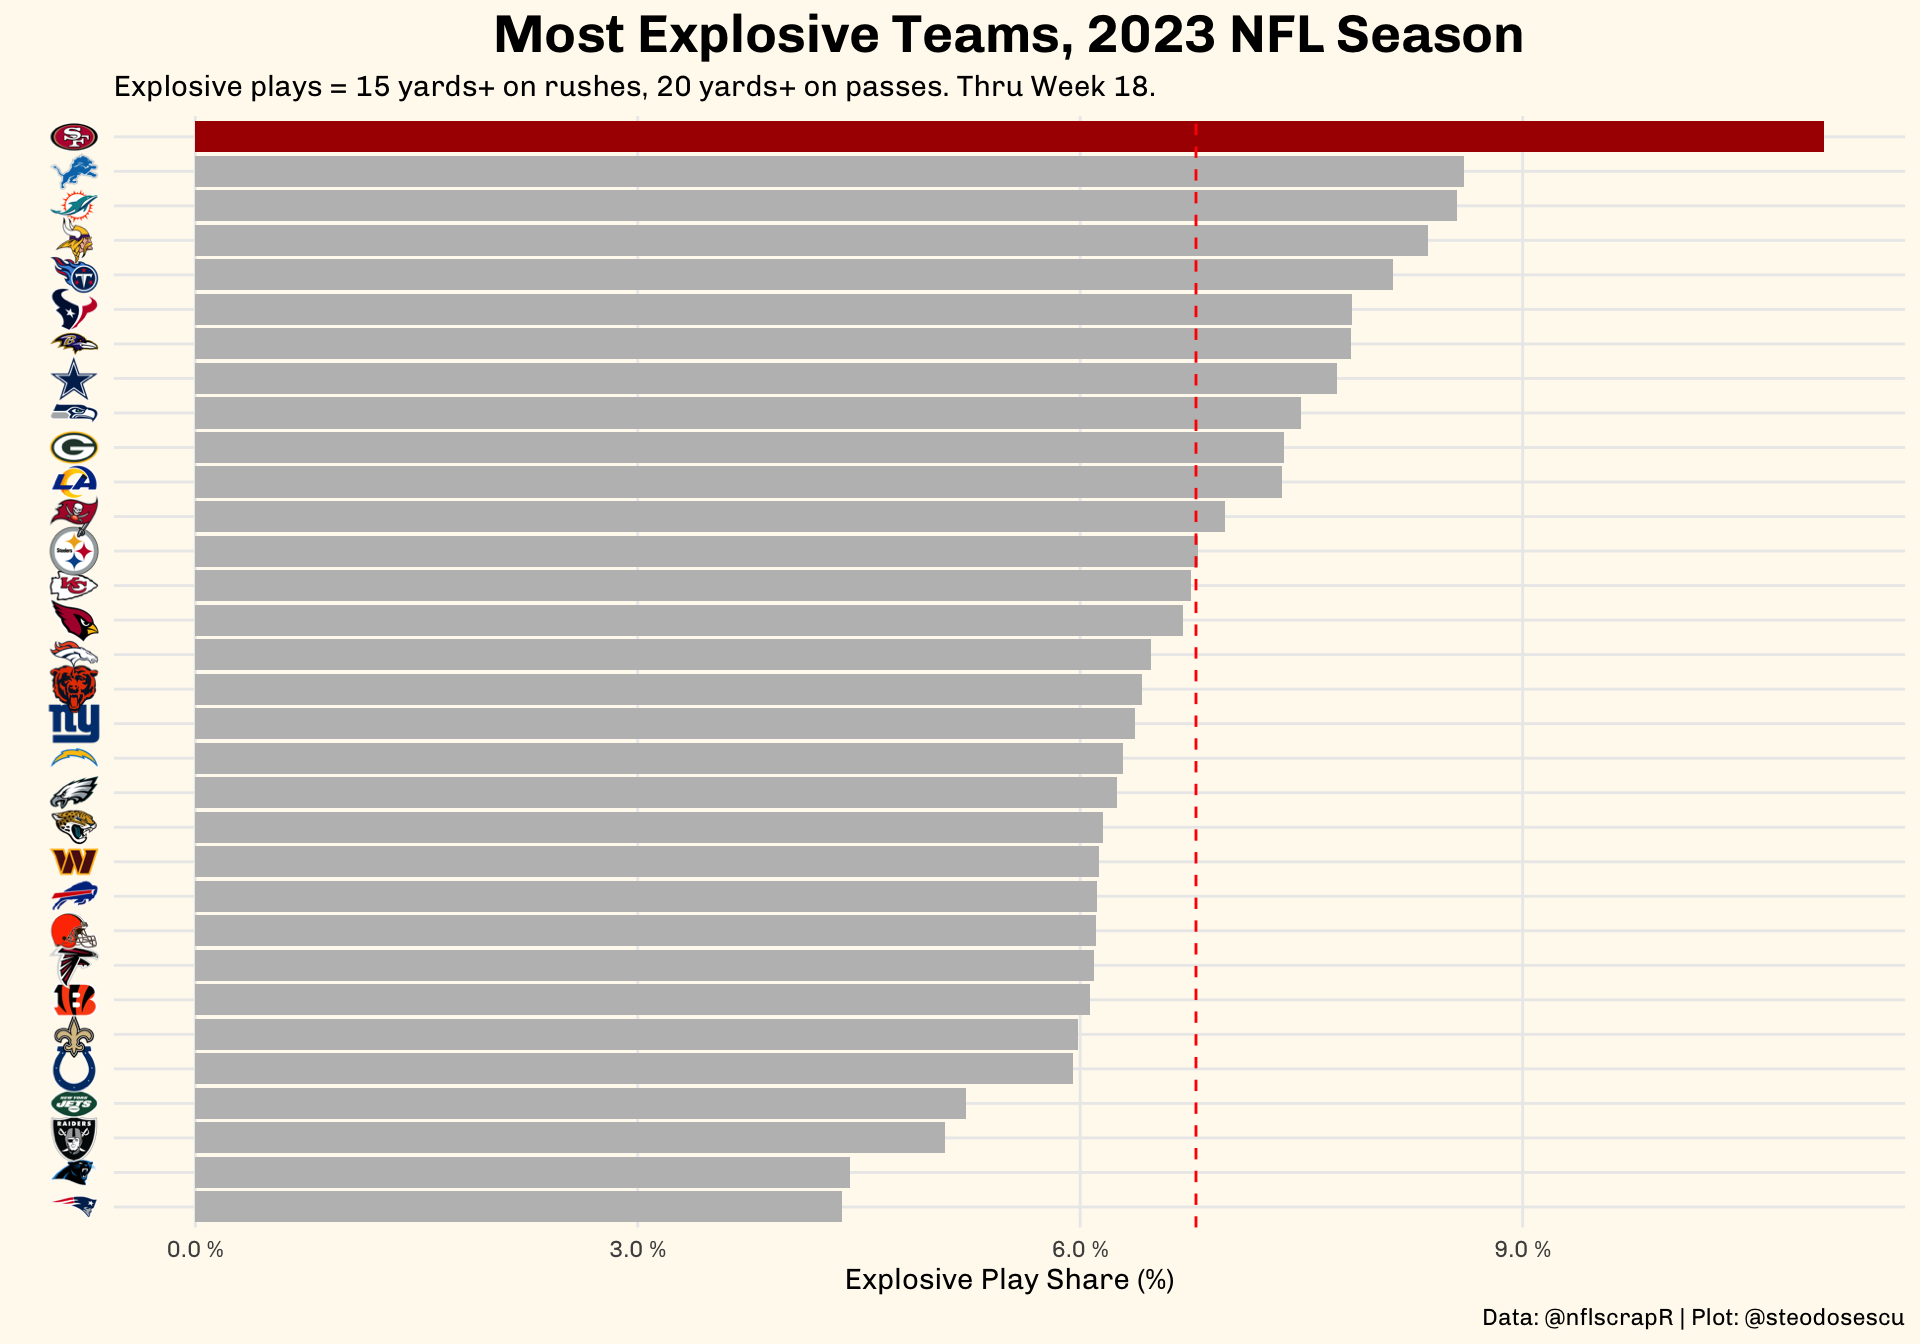
Explosive Plays
Some teams are better than others at getting chunk plays. We’re defining explosive plays as those gaining 15 yards or more on rushes and 20 yards+ on passes. We’re highlighting the 49ers this season since they have been among the most exciting teams to watch.
Strength of Schedule
Coming soon…
Copyright © 2021 Stephan Teodosescu