Teams
Last updated: 2026-07-26
Below you’ll find figures showing the latest traditional and advanced metrics I’m tracking for all 30 MLB teams.
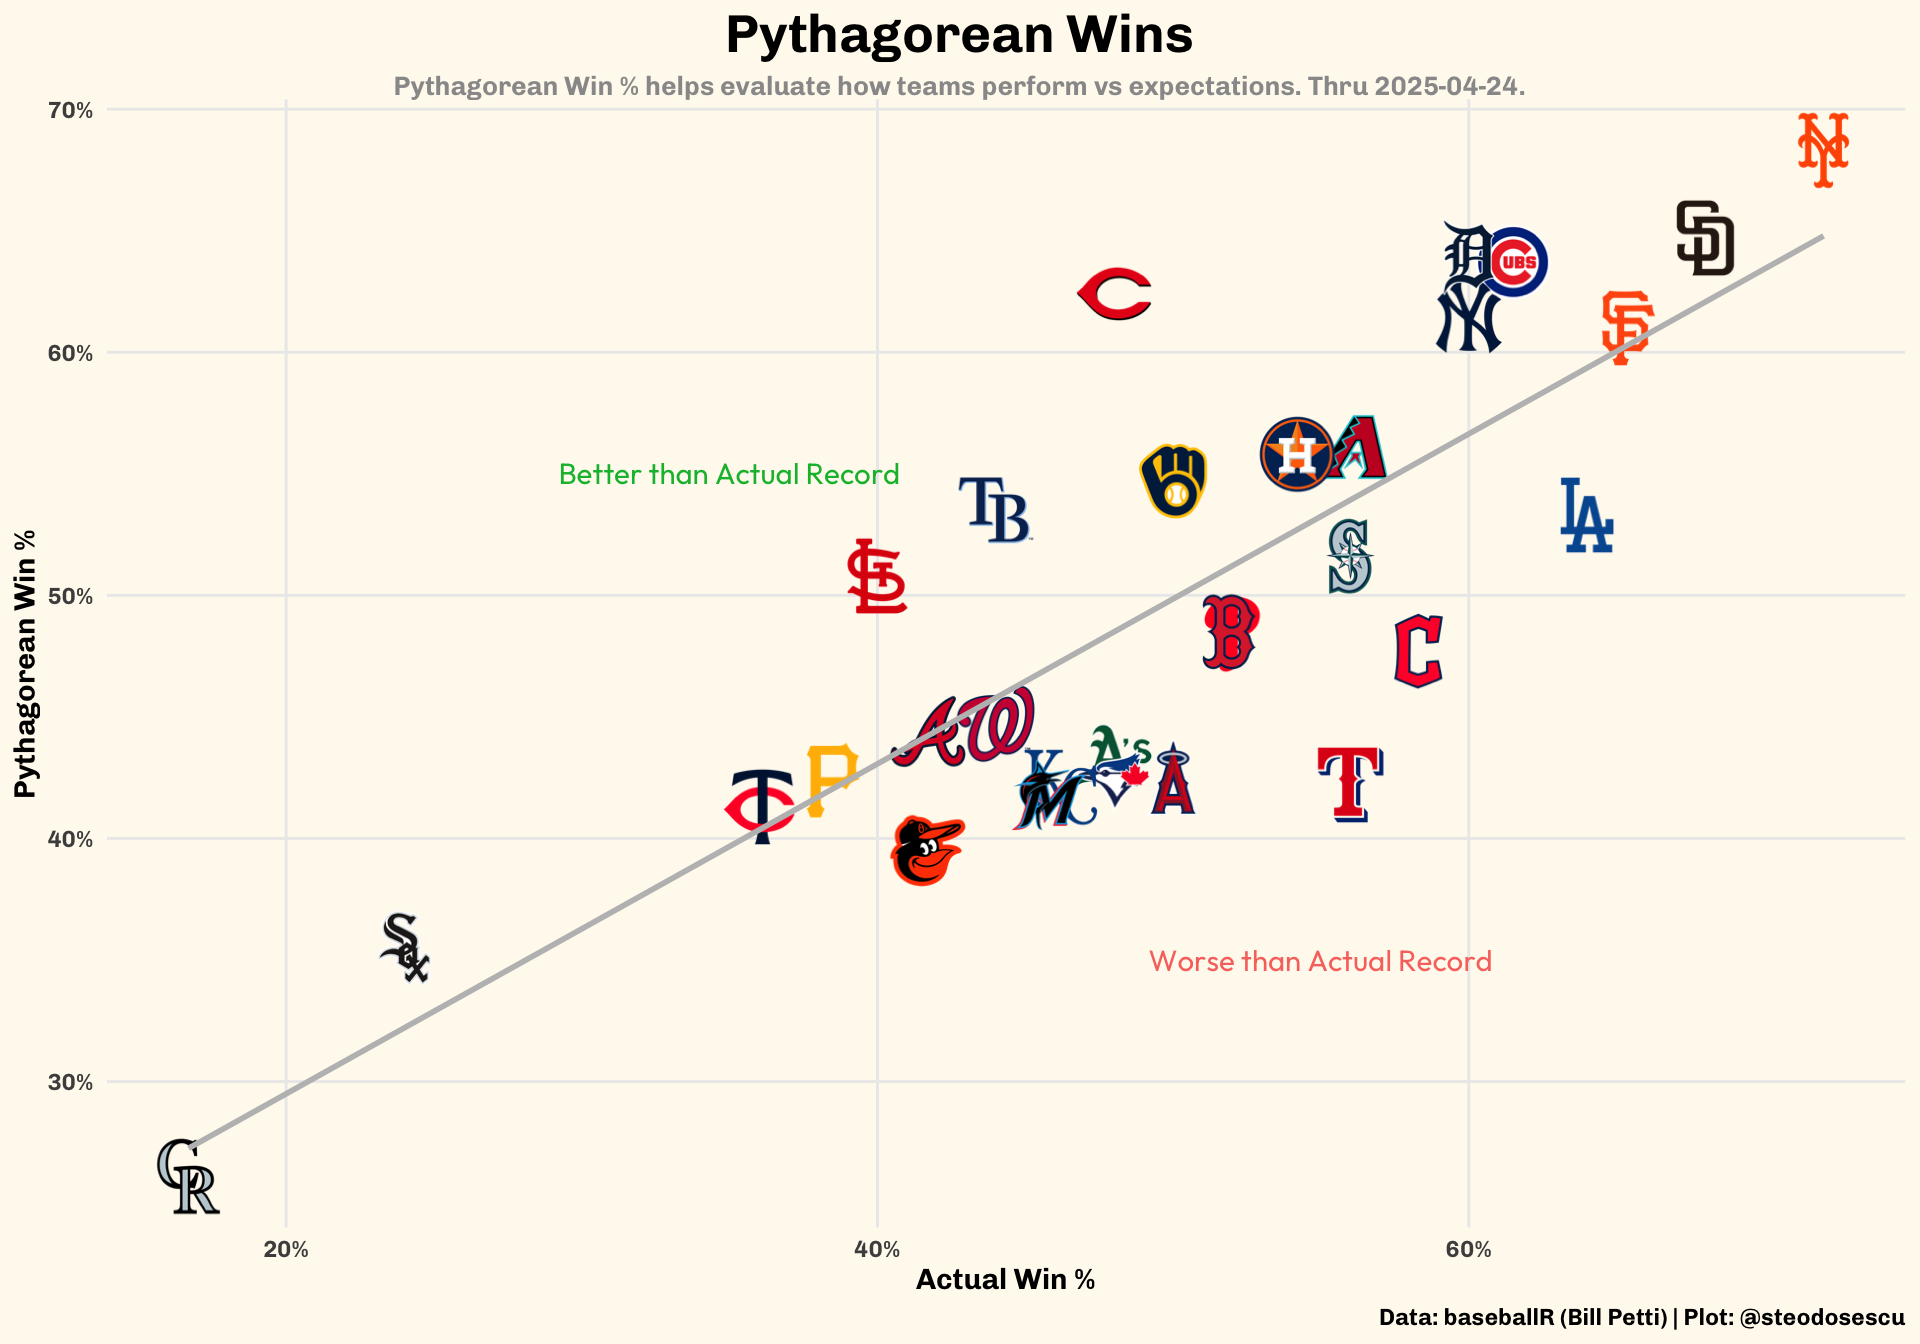
Pythagorean Wins
The below shows each team’s actual win percentage vs their pythagoroean win percentage. Pythagorean winning percentage is a formula developed by renowned statistician Bill James. The concept strives to determine the number of games that a team should have won – based on its total number of runs scored versus its number of runs allowed. It can help identify teams that have either overachieved or underachieved, and better predict a team’s future performance.
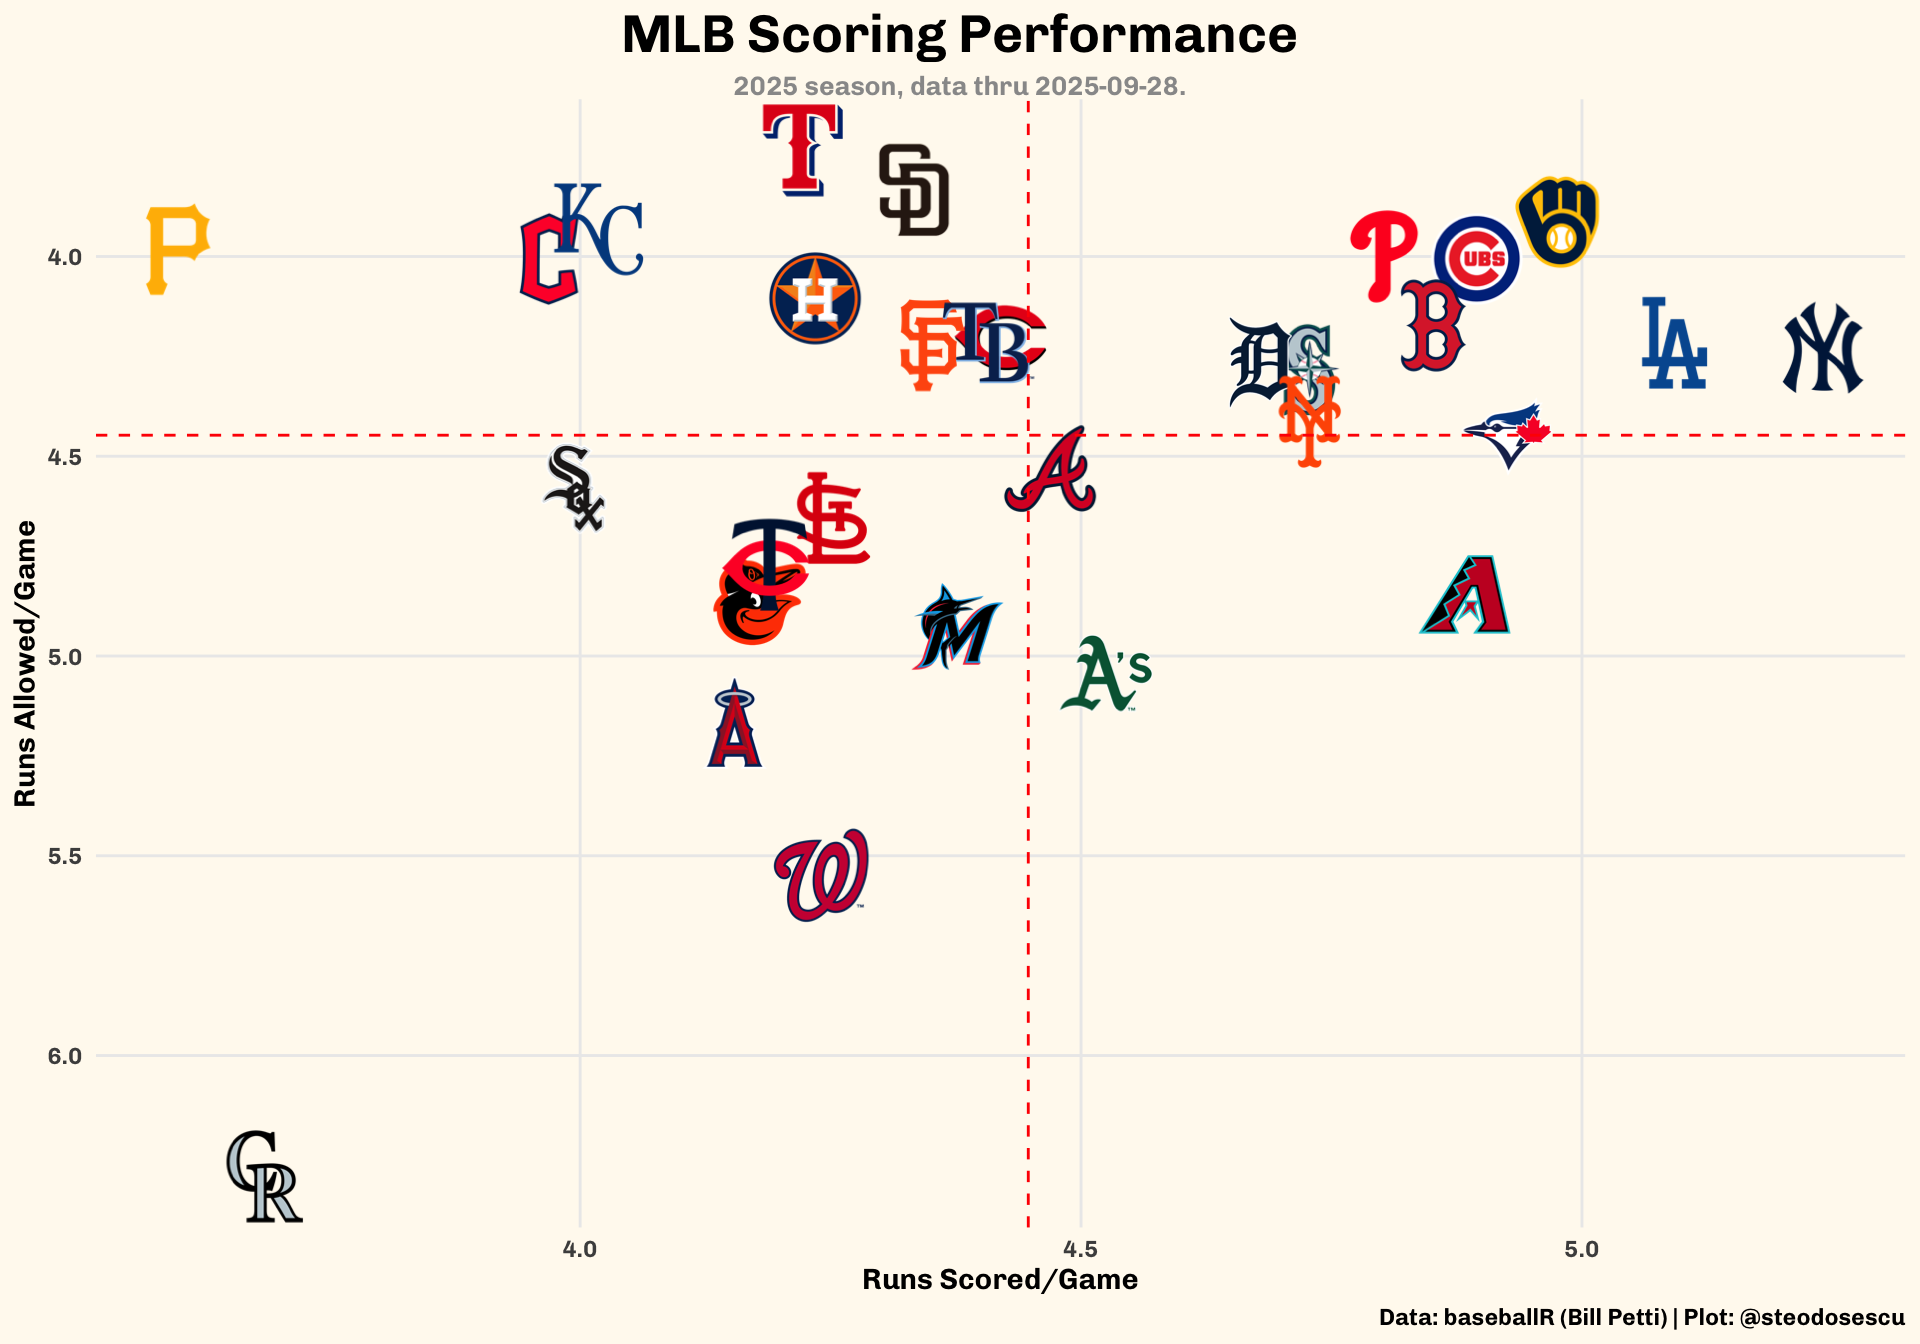
MLB Team Performance
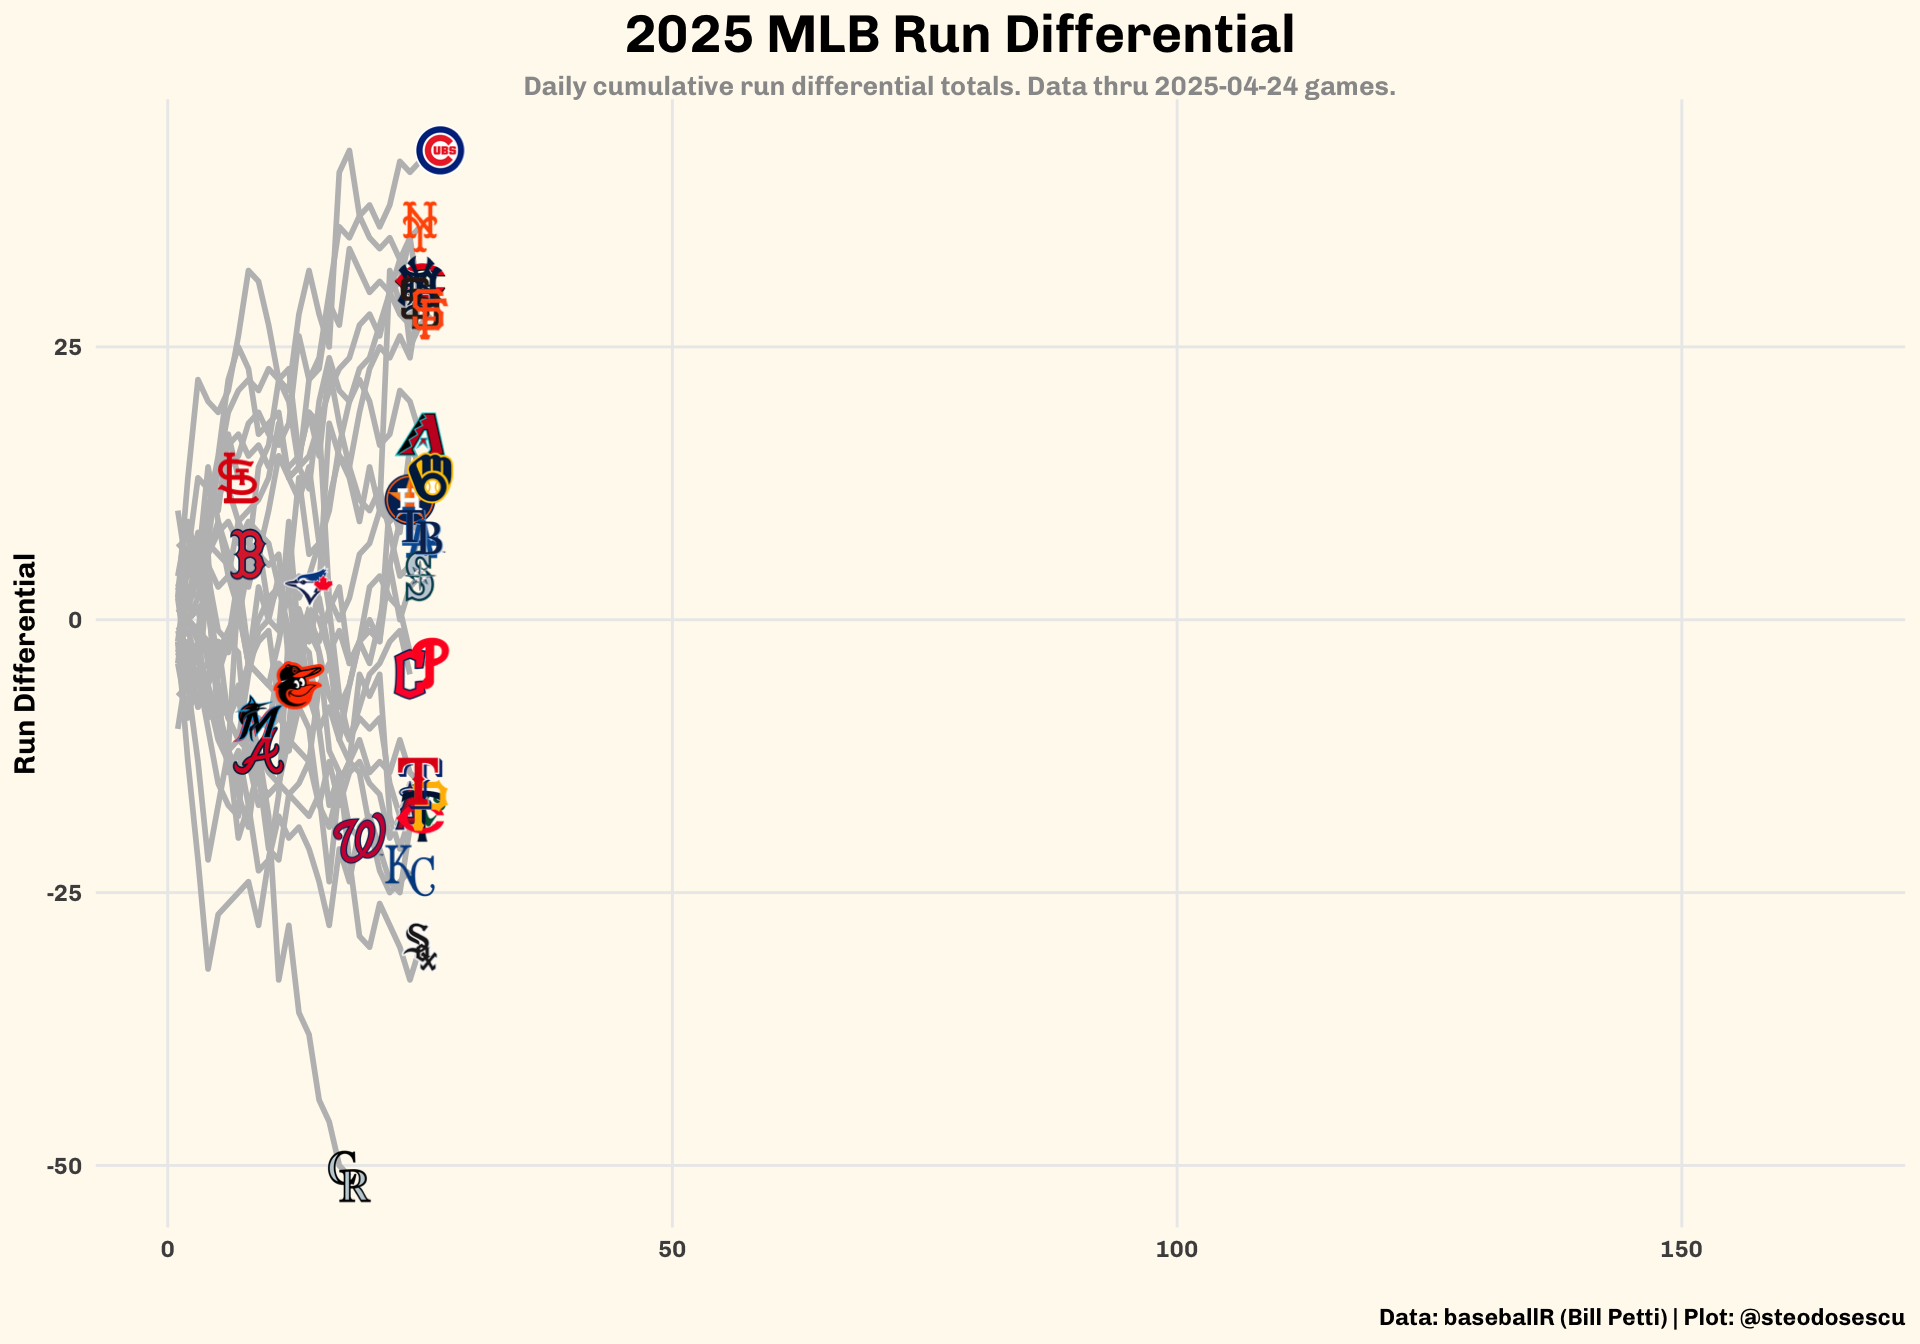
Run Differential Evolution
Evolution of each team’s run differential this season.
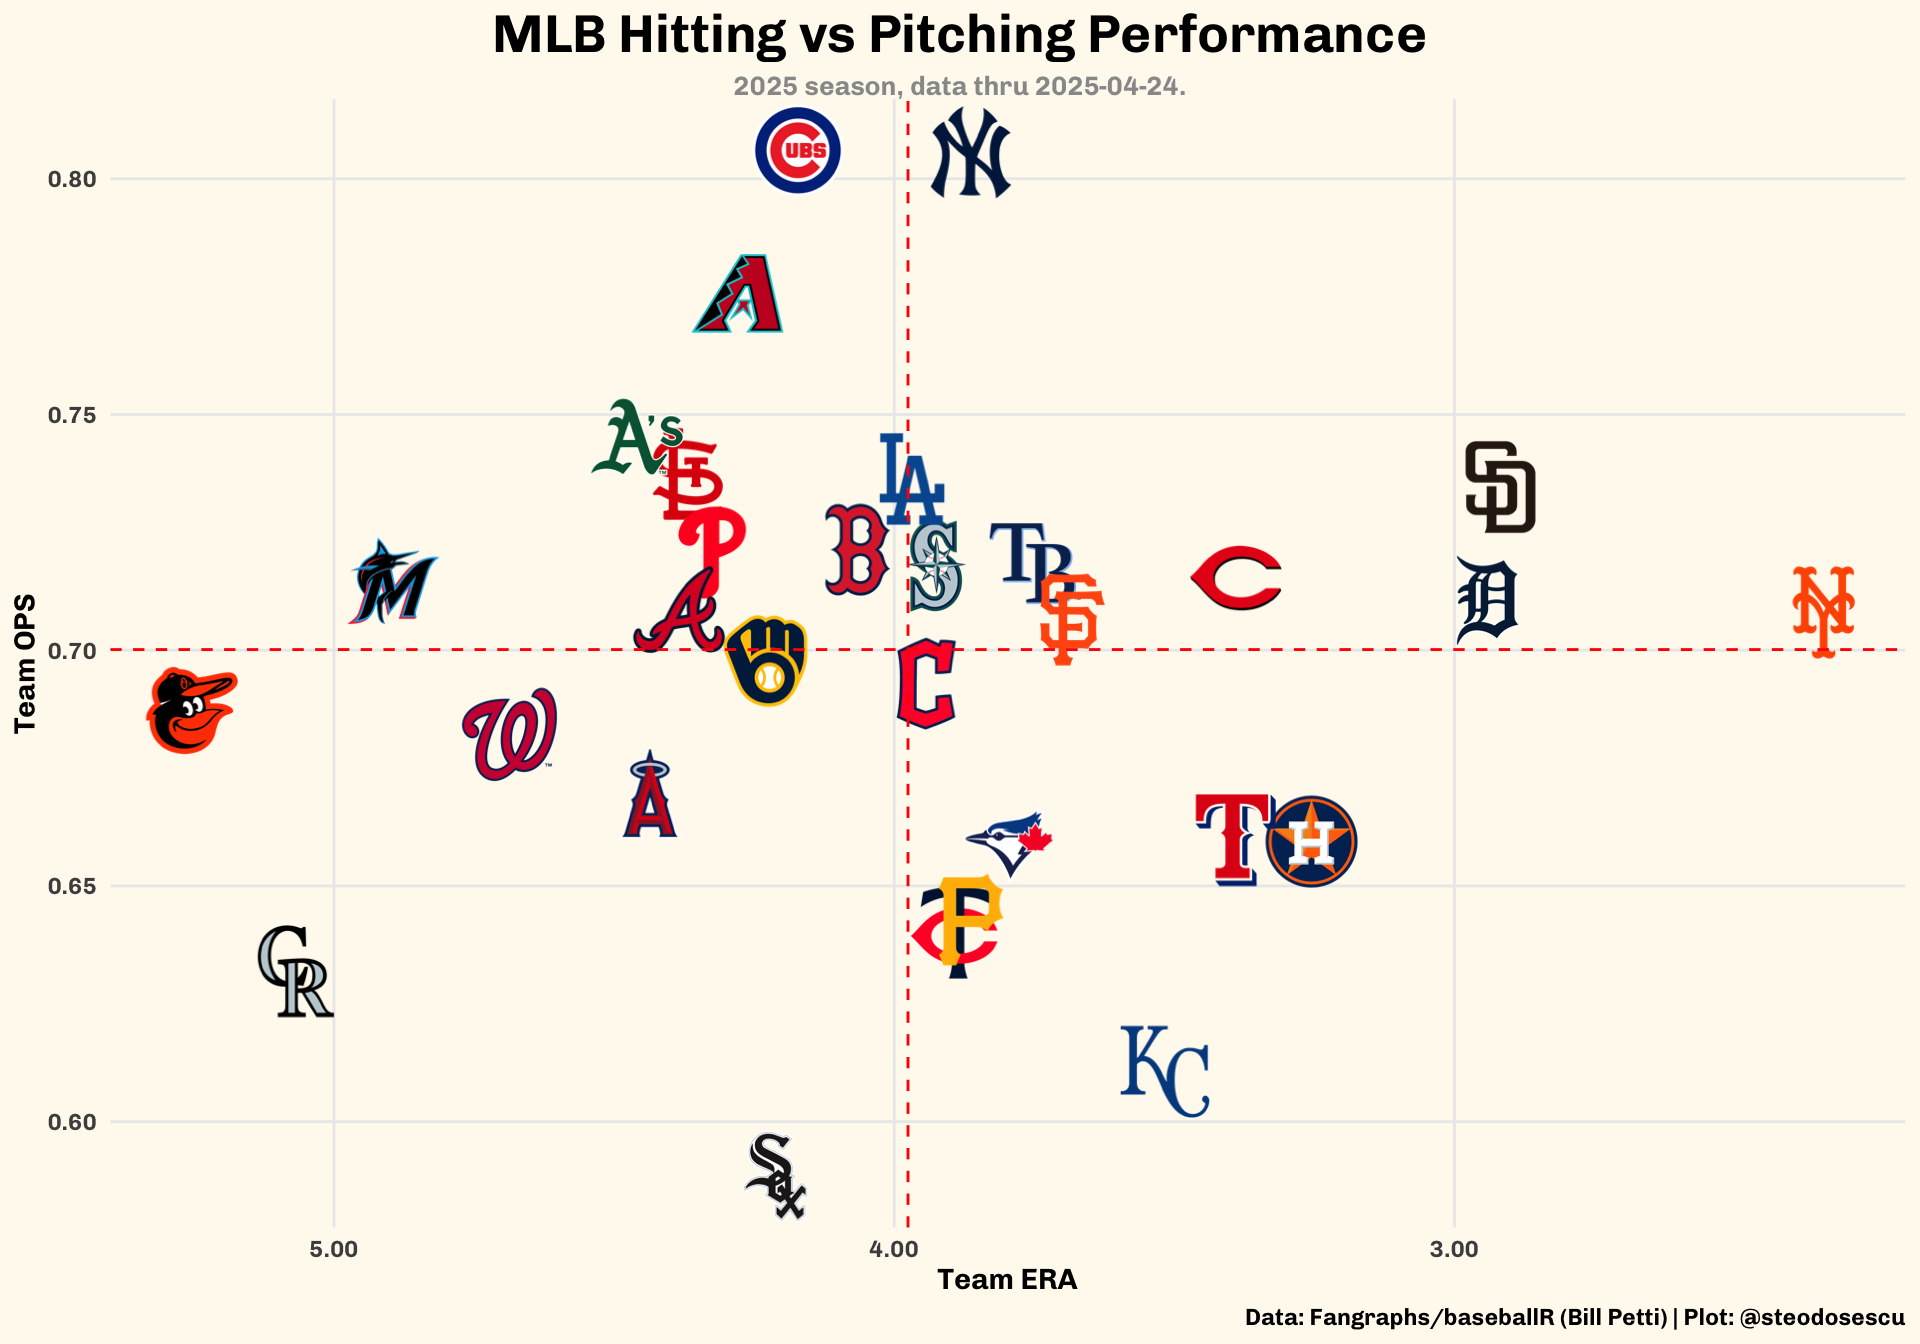
Team ERA vs Team OPS
Comparison of team-level pitching (ERA) and hitting (OPS)
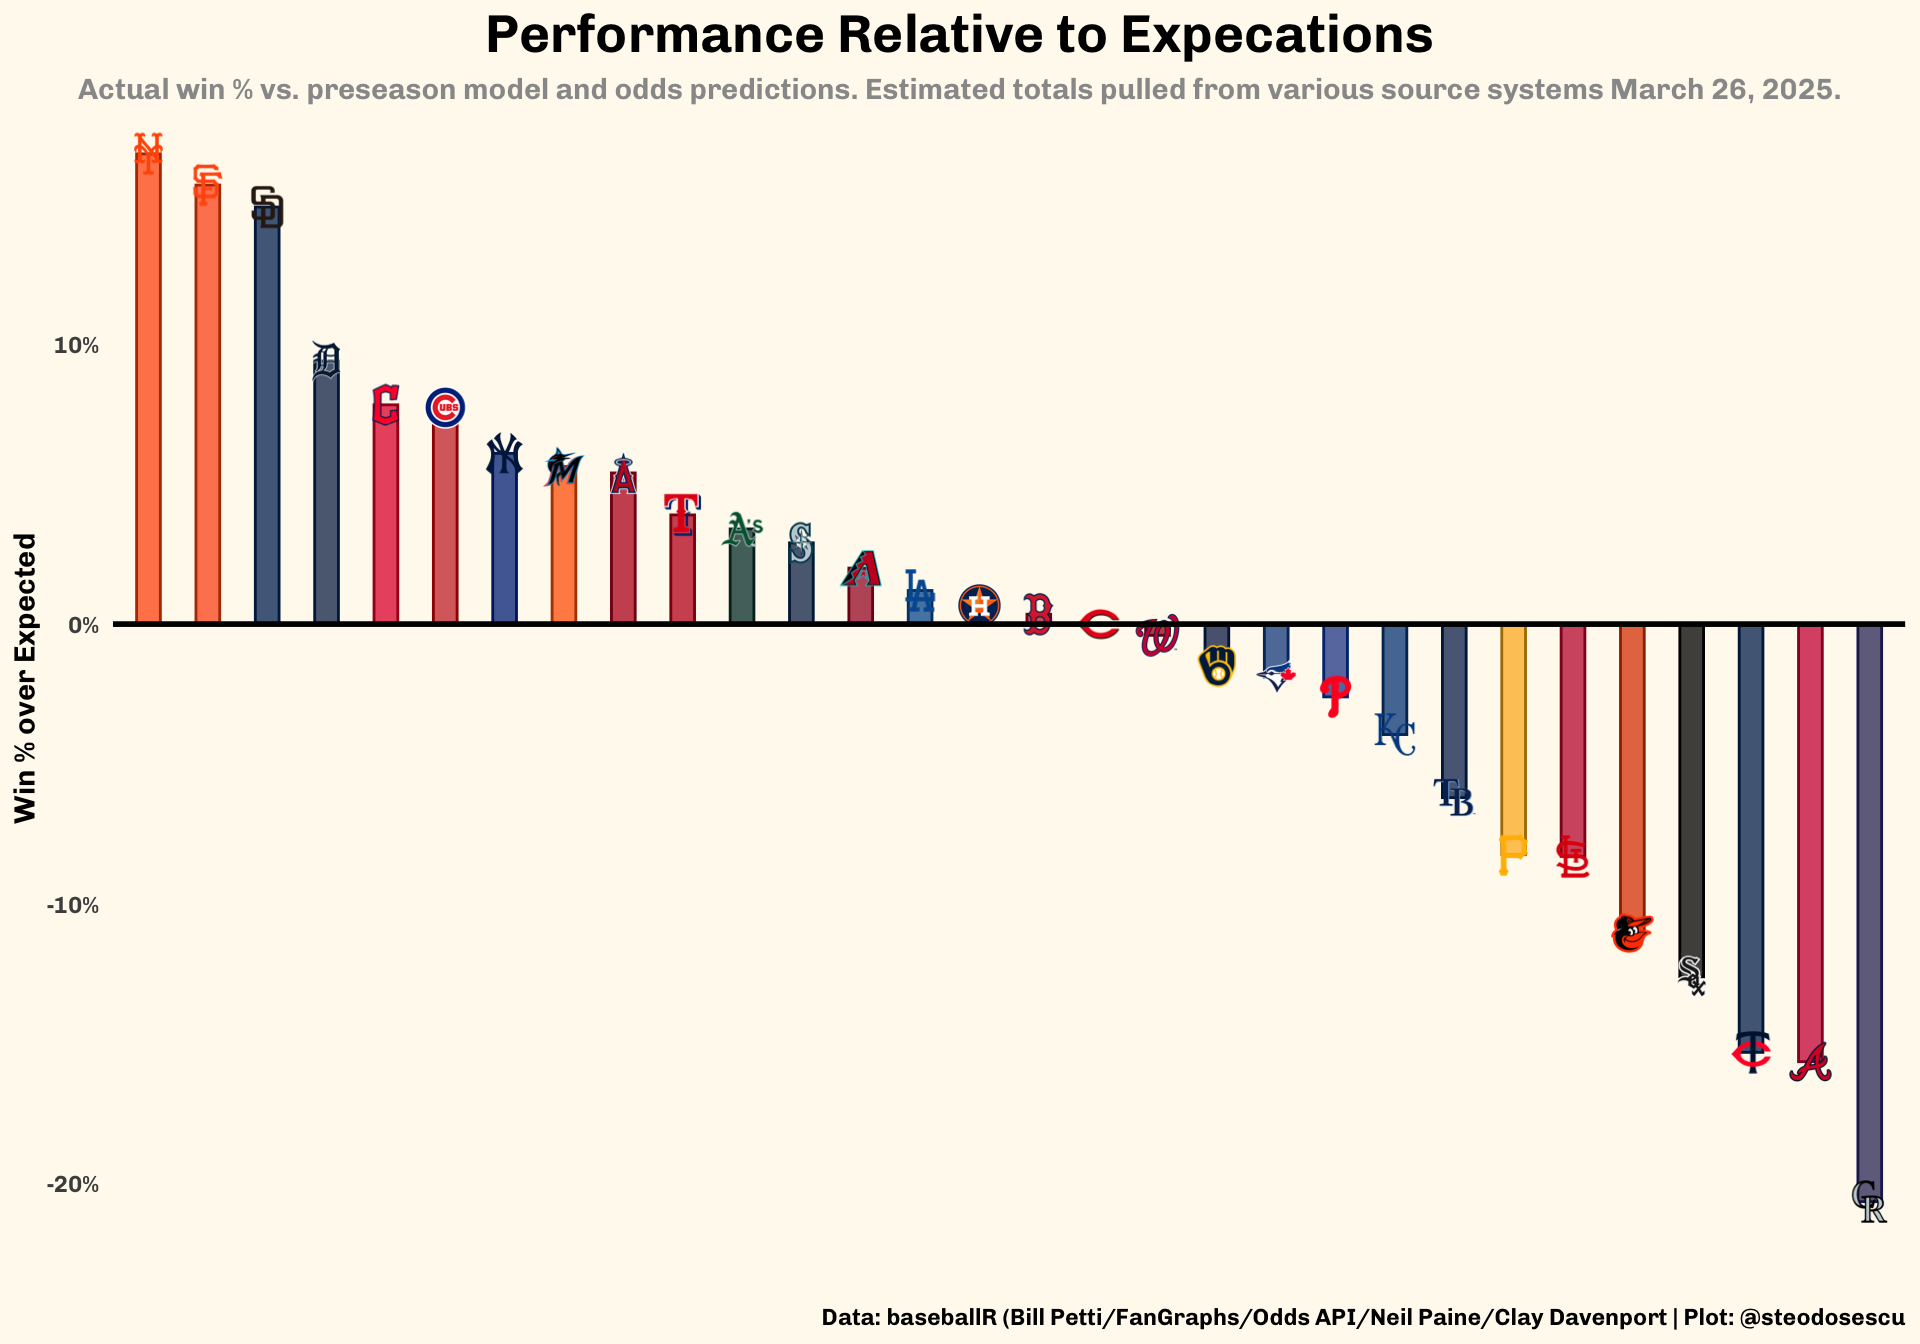
Performance vs Expectations
The below shows current win totals – expressed in win totals – compared to pre-season win total expectations, according to FanGraphs. Expected win total data was pulled during Spring Training in early March 2026.
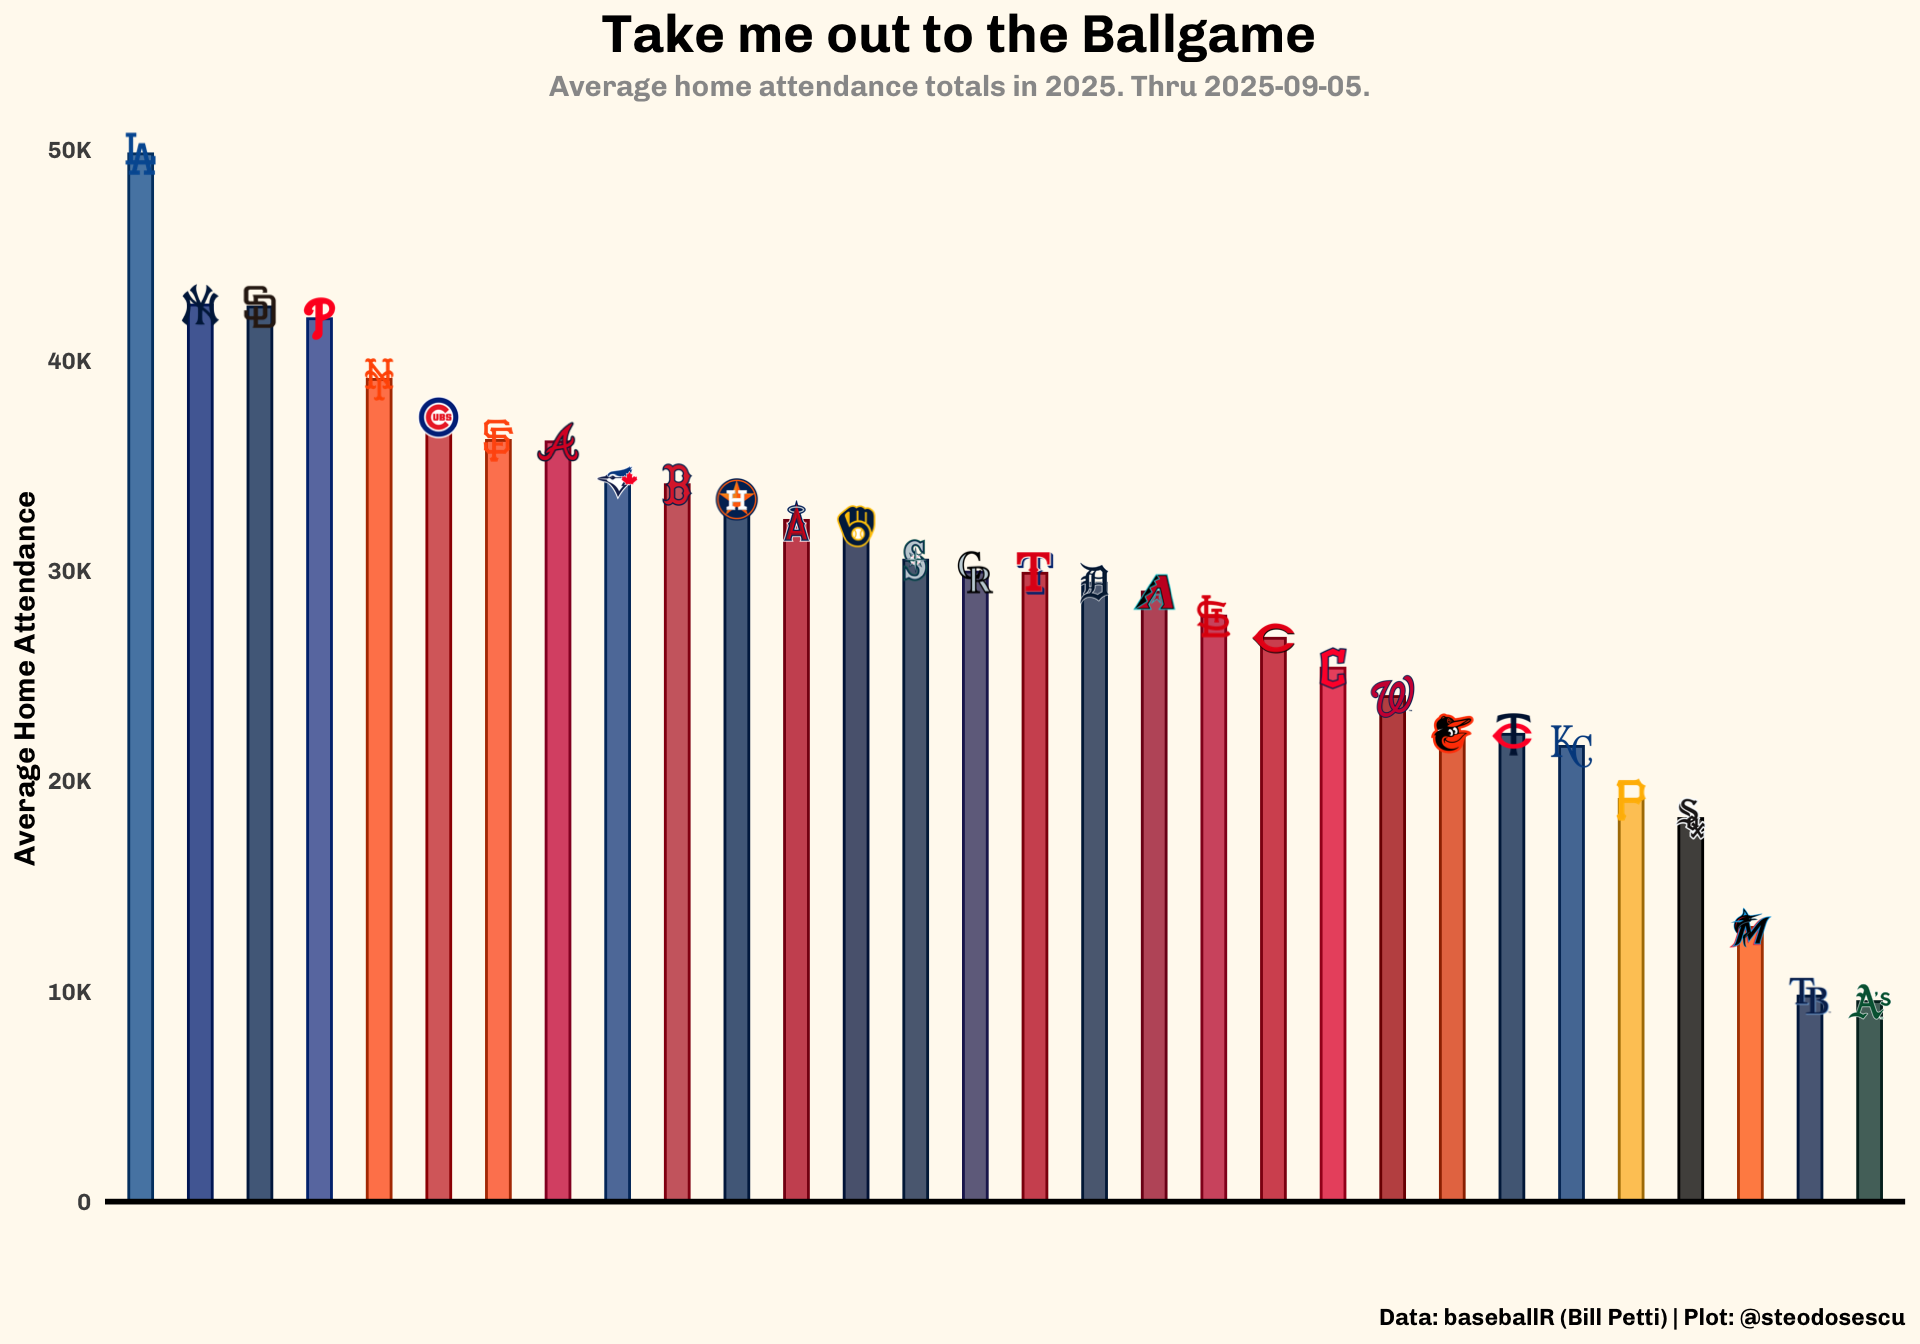
Attendance Profiles
2026 Attendance totals. The Los Angeles Dodgers lead the league in attendance, averaging 50,544 fans per game.
Team Ranks
League rankings among several popular advanced stats metrics.
| MLB Team Ranks | ||||||||||||
| League rankings (1-30) across several advanced statistical categories sourced from MLB, Fangraphs, and Statcast data. Sorted by overall team WAR (Fangraphs). Data thru games as of 2026-07-25. | ||||||||||||
| Team |
Batting/Baserunning
|
Fielding
|
Pitching
|
|||||||||
|---|---|---|---|---|---|---|---|---|---|---|---|---|
| OBP | OPS | wOBA | wRC | XBR | FP | DRS | ERA | WHIP | AVG | |||
| 1 |  |
LAD | 1 | 1 | 1 | 1 | 9 | 1 | 3 | 3 | 1 | 1 |
| 2 |  |
MIL | 4 | 7 | 7 | 6 | 1 | 6 | 7 | 2 | 2 | 2 |
| 3 |  |
NYY | 20 | 9 | 12 | 15 | 3 | 20 | 11 | 1 | 4 | 3 |
| 4 |  |
PIT | 3 | 3 | 3 | 3 | 16 | 22 | 18 | 20 | 18 | 15 |
| 5 |  |
TEX | 11 | 15 | 10 | 14 | 24 | 9 | 20 | 21 | 11 | 17 |
| 6 |  |
BOS | 19 | 21 | 20 | 24 | 4 | 10 | 4 | 4 | 7 | 14 |
| 7 |  |
TBR | 5 | 6 | 6 | 7 | 5 | 23 | 2 | 9 | 3 | 6 |
| 8 |  |
CHC | 2 | 4 | 4 | 4 | 19 | 3 | 1 | 15 | 10 | 18 |
| 9 |  |
BAL | 10 | 17 | 15 | 13 | 10 | 25 | 13 | 14 | 19 | 22 |
| 10 |  |
CHW | 13 | 16 | 15 | 16 | 6 | 14 | 26 | 11 | 17 | 9 |
| 11 |  |
MIA | 7 | 10 | 8 | 9 | 2 | 27 | 27 | 10 | 9 | 4 |
| 12 |  |
CLE | 23 | 28 | 28 | 26 | 26 | 19 | 11 | 8 | 12 | 12 |
| 13 |  |
SEA | 24 | 28 | 27 | 28 | 27 | 15 | 23 | 6 | 5 | 11 |
| 14 |  |
ATL | 17 | 8 | 9 | 11 | 12 | 12 | 5 | 7 | 8 | 5 |
| 15 |  |
DET | 22 | 19 | 18 | 19 | 7 | 10 | 22 | 5 | 6 | 7 |
| 16 |  |
PHI | 30 | 24 | 25 | 25 | 14 | 16 | 30 | 17 | 14 | 26 |
| 17 |  |
TOR | 28 | 30 | 30 | 30 | 30 | 27 | 13 | 13 | 15 | 16 |
| 18 |  |
WSN | 6 | 2 | 2 | 2 | 11 | 30 | 19 | 27 | 26 | 27 |
| 19 |  |
SDP | 27 | 26 | 26 | 27 | 18 | 4 | 17 | 18 | 21 | 21 |
| 20 |  |
MIN | 12 | 13 | 13 | 8 | 22 | 17 | 29 | 25 | 24 | 23 |
| 21 |  |
STL | 14 | 25 | 24 | 23 | 13 | 7 | 16 | 12 | 20 | 24 |
| 22 |  |
ARI | 21 | 20 | 23 | 21 | 8 | 2 | 8 | 19 | 13 | 25 |
| 23 |  |
HOU | 16 | 11 | 14 | 12 | 20 | 7 | 21 | 26 | 25 | 13 |
| 24 |  |
SFG | 26 | 14 | 17 | 18 | 28 | 26 | 6 | 22 | 22 | 20 |
| 25 |  |
NYM | 29 | 27 | 29 | 29 | 17 | 29 | 9 | 16 | 16 | 10 |
| 26 |  |
LAA | 14 | 23 | 21 | 20 | 29 | 21 | 24 | 24 | 23 | 8 |
| 27 |  |
KCR | 18 | 18 | 19 | 17 | 25 | 13 | 10 | 28 | 28 | 28 |
| 28 |  |
ATH | 9 | 12 | 11 | 10 | 23 | 5 | 25 | 29 | 29 | 29 |
| 29 |  |
COL | 8 | 5 | 5 | 5 | 15 | 24 | 13 | 30 | 30 | 30 |
| 30 |  |
CIN | 25 | 22 | 22 | 22 | 21 | 18 | 28 | 23 | 27 | 19 |
| DATA: baseballR (Bill Petti) TABLE: @steodosescu |
||||||||||||